Predictive Analytics in Real Estate 2025: How AI Is Driving Smarter Investments
90% of the time, you feel a deal is a winner — but by the time the numbers finally “prove it,” someone else has already taken it off the table.
But there is a way to avoid this. A way to consistently spot winners — the deals that appreciate faster, cash-flow stronger, and outperform your expectations. And the best part? You can see them before the market even knows they exist.
Predictive Analytics.
Predictive analytics flips the script by analyzing millions of data points and highlighting the exact opportunities you should act on before the rest of the market catches on.
What Is Predictive Analytics in Real Estate?
Predictive analytics is the process of using historical data, statistical models, and machine learning to forecast future outcomes—such as property values, rent growth, risks, and market trends.
In real estate, predictive analytics helps investors answer the questions that traditional analysis can’t:
- Which property will appreciate?
- Which neighborhood will boom?
- What risks are rising?
- Which deal will outperform?
It works by analyzing thousands of variables—location data, demographics, economic indicators, market cycles, consumer behavior, infrastructure development, and more—to identify patterns humans simply can’t see.
Predictive analytics takes the guesswork out and replaces it with math + machine intelligence, so your returns aren’t determined by luck — they’re engineered. Predictive analytics is becoming the foundation of smarter, safer, and more profitable real estate investing.
The Market Reality
Real estate investing in 2025 isn’t the same game your mentors played. Here’s what you’re really up against:
Too much data for any human to digest: Sales, rents, migration, crime, schools, interest rates, and over 100 data points… It’s overwhelming.
Markets are more volatile than ever: One policy change or economic fluctuation can wipe out your returns.
Speed wins: The investor who analyzes deals fastest gets the deal. Everyone else gets “next time.”
AI is becoming mainstream: Your competitors are already using predictive models to find undervalued deals.
The era of “gut-feel investing” is dying: Data-driven investors will outperform intuition-driven investors in every cycle.
Why Most Real Estate Investments Fail? Multiple industry studies reveal that there are clear, recurring factors behind why real estate investments fail.
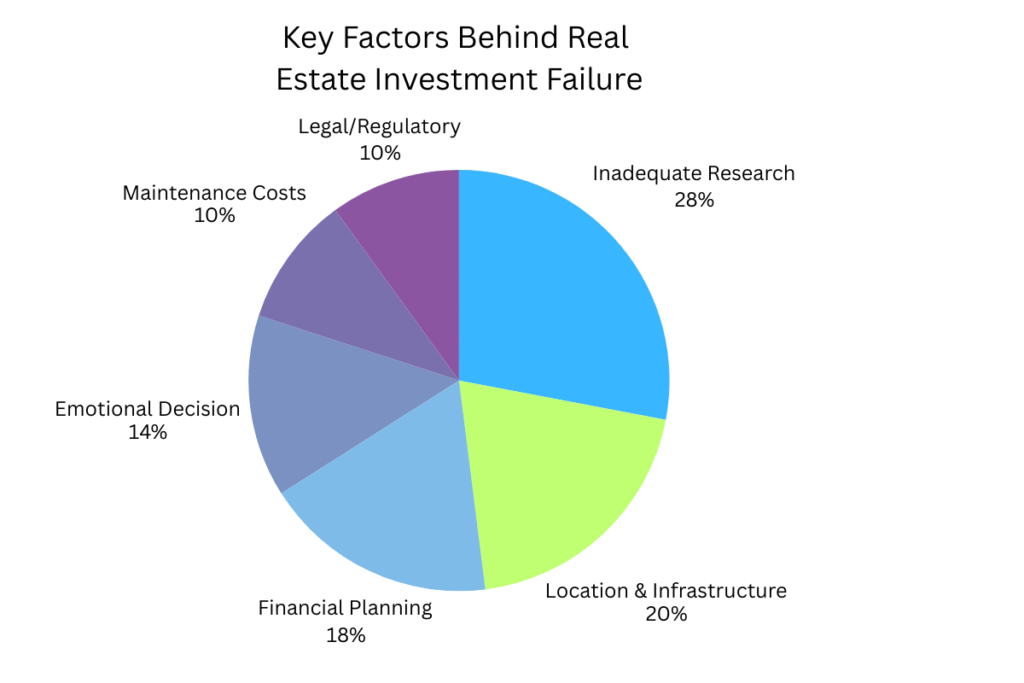
Major Findings Behind Investment Failures:
- Inadequate Research of the Property: 28%
- Ignoring Location Quality & Infrastructure: 20%
- Ignoring Financial Planning/Underwriting: 18%
- Emotional Decision Making: 14%
- Underestimating Maintenance & Repair Costs: 10%
- Neglecting Legal/Regulatory Considerations: 10%
Data Source: Multiple industry studies—from PwC’s Emerging Trends in Real Estate, Deloitte’s Real Estate Outlook, CBRE’s Global Investor Intentions, Harvard JCHS housing reports, and NAR investor surveys.
This is why predictive analytics is no longer a “nice-to-have.” It’s the new baseline for survival — and dominance.
How Predictive Analytics Works?
It’s a 5-step process-
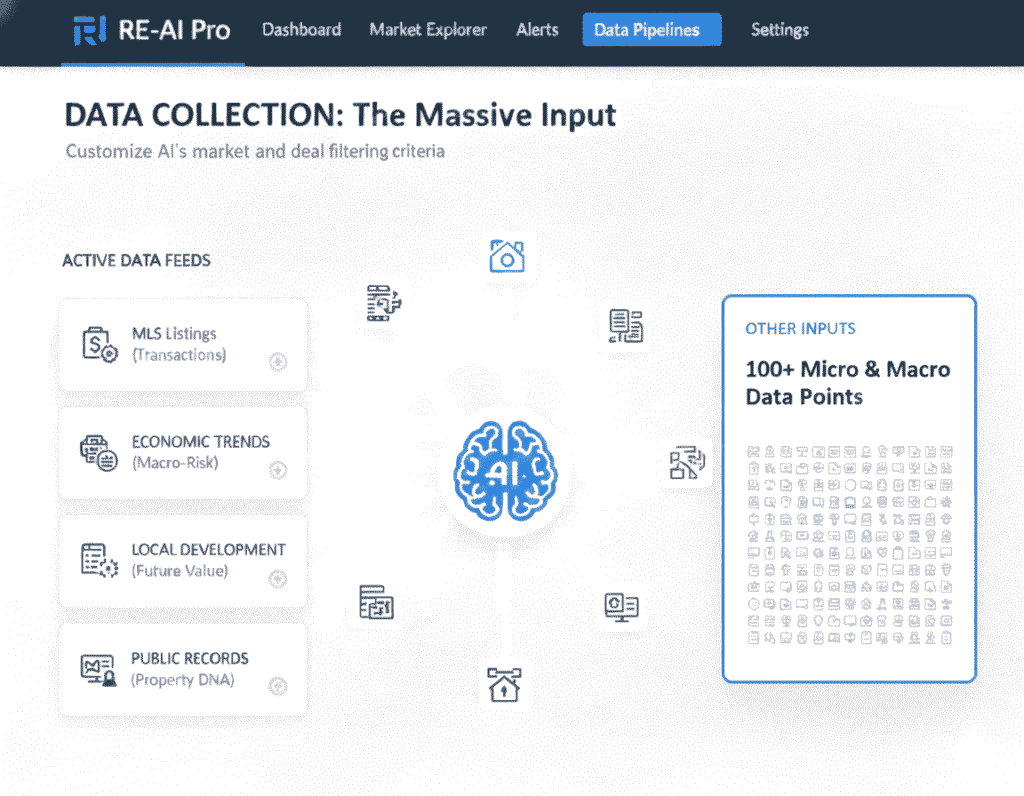
Step 1: Data Collection
AI gathers data from internal and external sources:
- MLS: Transaction history and current listings (The What).
- Rent Rolls: Actual and projected rental income data (The Yield).
- Economic Trends: Interest rates, employment, and inflation (The Macro-Risk).
- Local Development: Zoning changes and new infrastructure projects (The Future-Value).
- Demographics: Population density, income levels, and migration (The Demand).
- Public Records: Deeds, taxes, and permits (The Foundation).
- 100+ more sources
A real estate company must have a data strategy. Here’s how companies in the industry are using data today:
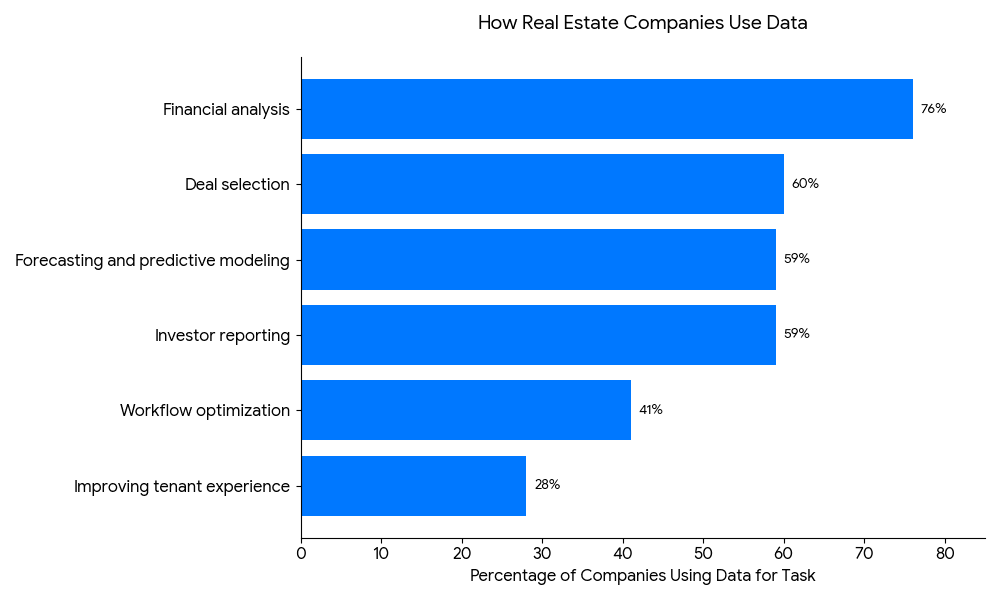
- 28% use it to improve tenant experience
- 76% use data for financial management & analysis
- 60% use it for deal evaluation and major development decisions
- 59% rely on data for reporting to stakeholders
- 59% use it for forecasting and predictive analytics
- 41% apply data to process optimization
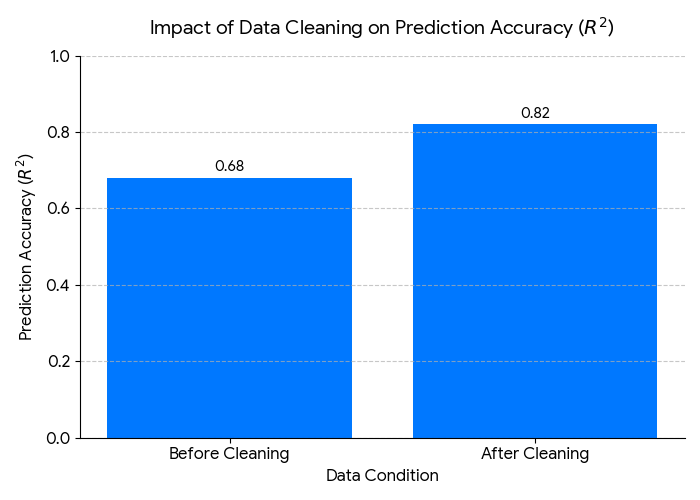
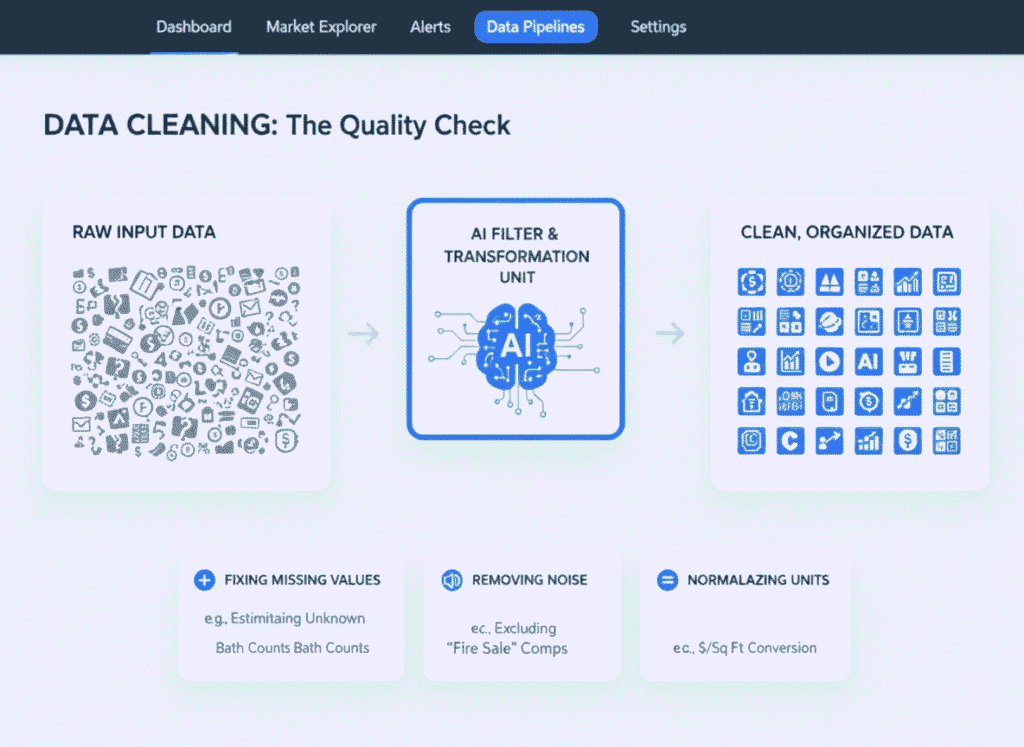
Step 2: Data Cleaning
Garbage in, garbage out. The vast majority of time in any AI process is spent here. All that raw data comes in messy, error-prone, and in a thousand different formats.
Look—clean data isn’t just a “technical step.” It’s the difference between a model that guesses and a model that prints money.
After data cleaning, prediction accuracy jumps by up to 21%, and model efficiency improves by another 7%. [2]
And here’s where it gets crazier: When machine learning models combine traditional + non-traditional data(clean), they’ve been able to predict 3-year rent per sq. ft. with over 90% accuracy. This is the superpower clean data unlocks. [1]
Some Common Errors Eliminated in the Data Cleaning Stage:
- The AI fixes missing values (e.g., estimating an unknown bath count).
- It removes noise (e.g., excluding a “fire sale” that skews neighborhood comps).
- It normalizes every unit (e.g., converting all prices to dollars per square foot).
Step 3: Modeling
This is where the magic actually happens. Once the data is clean, AI stops “collecting” and starts thinking — running thousands of simulations to uncover patterns no analyst could see manually.
How modeling works:
- Data preparation: The process begins with collecting and preparing a dataset that the model will learn from.
- Model and algorithm selection: An appropriate algorithm is chosen based on the problem you want to solve, such as classifying images or predicting house prices.
- Training: The algorithm is trained on the dataset. During this stage, it learns to identify patterns and adjust its internal parameters to make more accurate predictions.
- Validation and testing: The model is tested with new data to evaluate its performance and accuracy.
- Deployment: Once the model is deemed accurate, it is deployed into a production environment where it can be used to make real-world predictions or decisions.
What ML Models Analyze:
- Price trends: How sensitive a neighborhood is to interest rate changes.
- Rent projections: Accurate future cash flow, factoring in local employer growth.
- Risk factors: The probability of market slowdown or foreclosure.
- Neighborhood growth patterns: Identifying the next “hot” submarket.
- Buying/selling pressure: Is this a good time to enter or exit?

The AI isolates the most powerful drivers of value, predicting what the market will do next, not just what it did last year. Let’s explore some drivers here-
Feature Importance:
Every investor guesses what moves the market: “It’s all about the schools,” or “It’s the cap rate!” The AI doesn’t guess. It objectively weights every variable and tells you exactly what matters most for prediction accuracy.
- What it shows: Which variables the ML model considers most influential when predicting price or rent.
- Why it matters: Investors immediately see what actually moves the market—not what they think moves it.
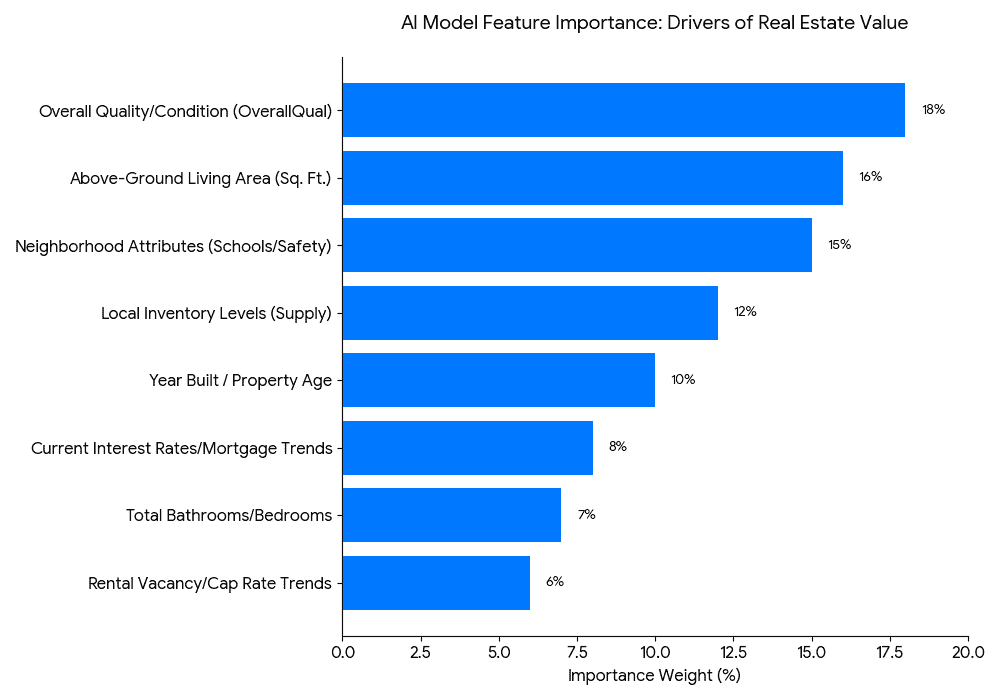
Which variables does the ML model consider most influential when predicting price or rent, as-
- Interest Rates:8%
- Overall Quality/Condition of property: 18
- Above-Ground living area(Sq.Ft): 16%
- Neighborhood attributes: 15%
- Demographics: 10%
- Inventory Levels:12%
- Year Built/Property age: 10%
- Total Bathroom/Bedrooms: 7%
- Cap Rate Trends: 6%
- Rental Vacancy:6%
Industry Use Case: Zillow & Redfin AVM(automated valuation models) research shows job growth, supply levels, and mortgage rates are top signals for prediction accuracy.
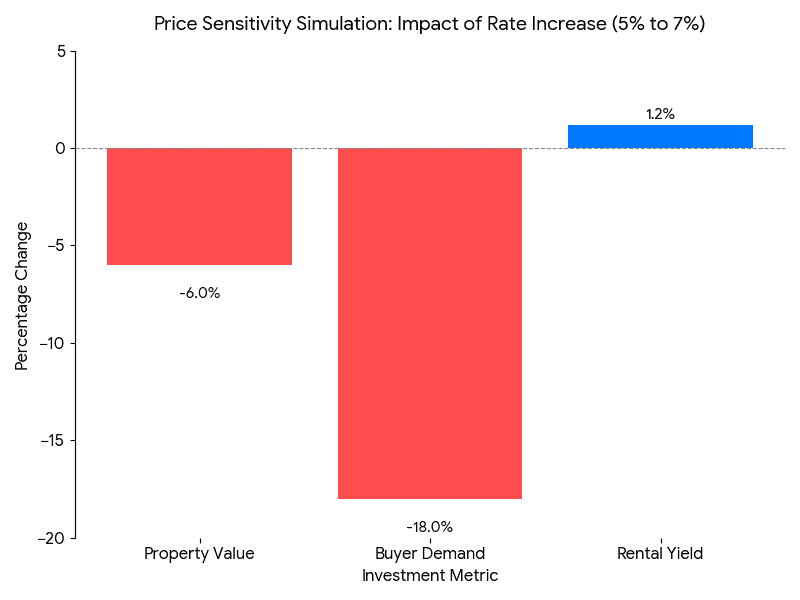
Price Sensitivity Simulation
How home values or rents respond when one key variable changes. Example, interest rate increases from 5% → 7%.
- Property value dips by –6%
- Buyer demand drops by –18%
- Rental yield increases +1.2%
Risk Probability Heatmap
If there’s one thing fund managers obsess over, it’s not the upside — it’s the downside. They don’t want fluffy forecasts. They want cold, quantified risk. And that’s exactly what this heatmap delivers.
Instead of staring at spreadsheets trying to guess what happens in a recession or a rate spike, AI runs scenario simulations and maps out the probability of losses across five economic environments. You literally see the danger zones.
What it shows:
A color-coded heatmap scoring the probability of four core risks — Price Decline, Rent Drop, Vacancy, and Liquidity Risk — across five scenarios (Base Market, Mild Recession, Major Recession, High Interest Rates, High Inflation).
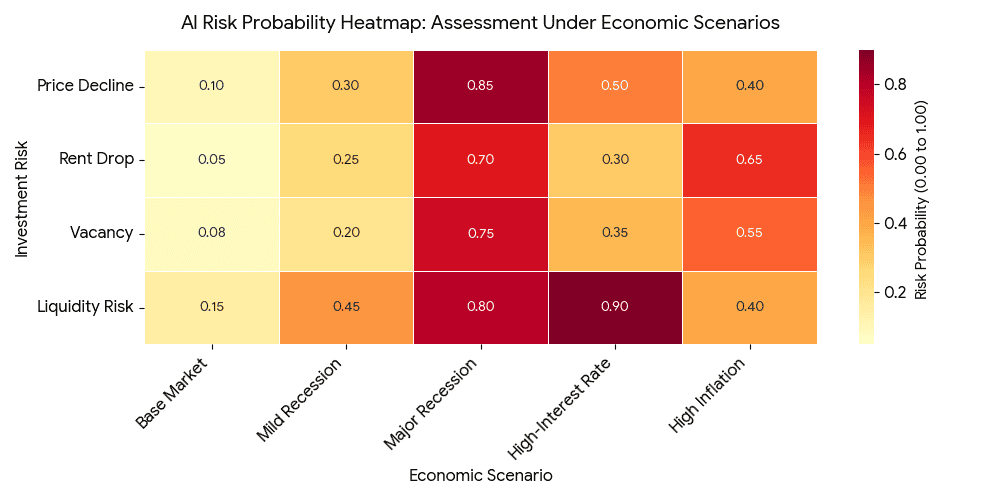
Why it matters:
This is the kind of chart investors look at and instantly go: “Oh damn… now I get it.”
No guesswork. No vague warnings. Just clear, visual, investor-grade risk intelligence — the same logic behind models from MSCI Real Estate and CoStar.[3]
Key Takeaways:
- Liquidity Risk blows up under a High-Interest-Rate scenario (0.90) — a flashing red sign that refinancing or new financing could get ugly.
- Major Recession hits every metric hard — price decline, rent drop, vacancy… it’s the all-around threat you “prepare for or perish.”
- This heatmap becomes your early-warning radar, helping you structure deals that survive the storm, not just look good on paper.
Neighborhood Growth Projection
Predicting the Next Hot Market. Here’s the truth most investors won’t admit. The big returns don’t come from buying in “good cities.” They come from spotting the tiny pockets inside those cities that are about to explode.
Instead of looking at city-wide averages (which hide more than they reveal), AI digs into micro-signals — zoning changes, building permits, demographic migration, school district shifts — and projects growth neighborhood by neighborhood.
What it shows:
A simple, brutally honest Forecast Line Chart comparing 36-month appreciation for three neighborhoods.
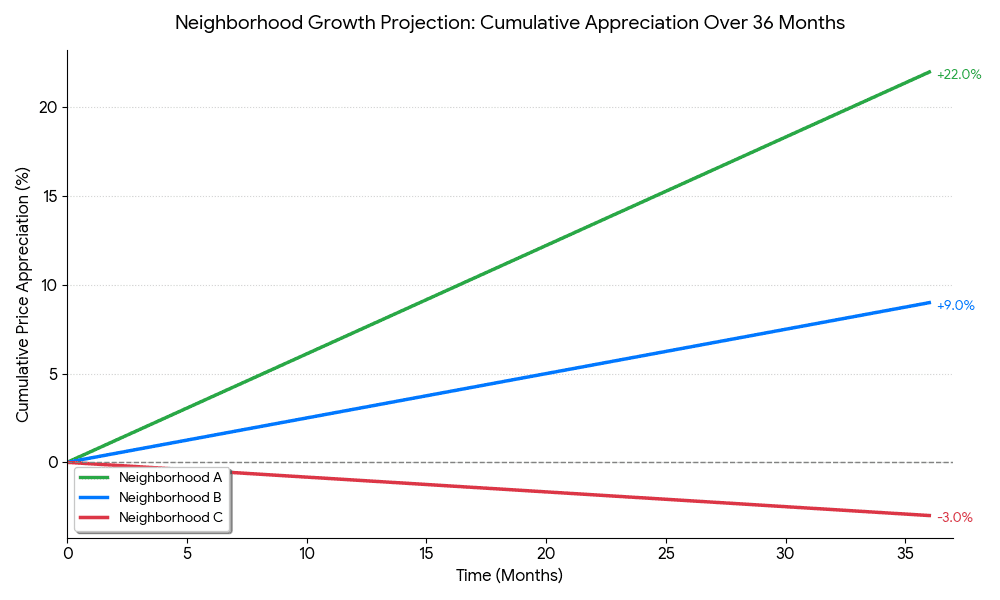
- Neighborhood A rockets to +22%
- Neighborhood B creeps to +9%
- Neighborhood C bleeds out to –3%
Why it matters: Investors love to talk about “timing the market.” This chart actually shows the timing.
It instantly validates the AI’s ranking — you can see which submarket deserves your money, which one to monitor, and which one to avoid like an overpriced flip project.
Takeaways: And this chart proves it — one neighborhood compounds your returns, another traps your equity, and the third quietly destroys it.
Real Word Use Case: This is the same micro-level forecasting approach emphasized by the Urban Institute and Brookings when they study neighborhood evolution.
Rent Forecast Accuracy
Every investor says they want better data. But what they actually want is proof — proof that the model isn’t guessing, proof that it beats intuition, and proof that it can actually forecast cash flow with confidence.
This chart delivers exactly that.
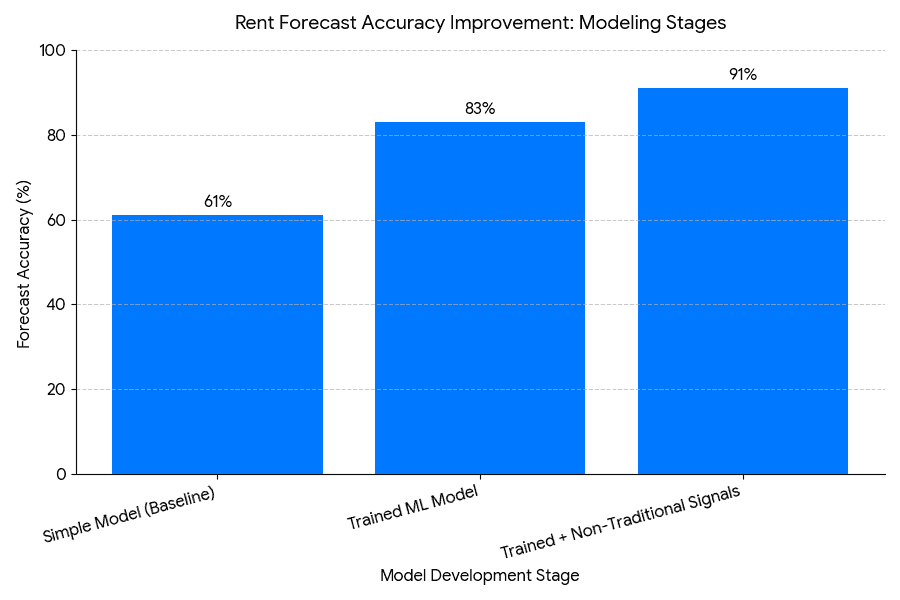
Bar chart comparing rent-forecast accuracy at three stages of model development.
Why it matters: Because the visual tells a story you can’t argue with:
The Model Jump:
Just by training the machine-learning model, accuracy blasts from 61% → 83%. A ridiculous +22-point leap — without adding a single fancy data source.
The Data Edge:
Add non-traditional signals (listing text, satellite imagery, neighborhood sentiment — the stuff your competitors can’t “eyeball”) and accuracy jumps again… all the way to 91%.
Real World Example: McKinsey’s research shows advanced analytics can boost forecasting accuracy by ~30%(61+30=91). This chart proves you’re right in that zone — and that you’re playing the same game as the institutional pros.
Buy/Sell Pressure Index
Ask any investor what matters most, and they’ll give you the same answer every time: “Timing.”
Buy too late → you lose upside.
Sell too late → you lose everything.
This chart fixes that.
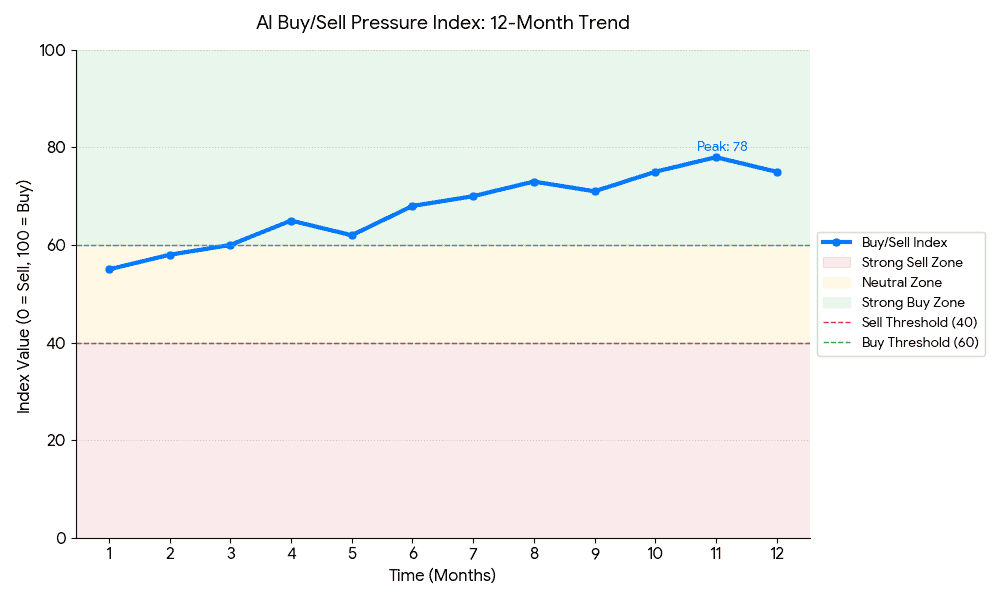
Because the AI isn’t giving you a static snapshot — it’s giving you momentum. It shows you where the market was, where it is, and where it’s heading before everyone else wakes up.
What it shows: A clean 12-month Line Chart tracking the Buy/Sell Pressure Index against the key thresholds:
- Sell Zone
- Neutral Zone (40–60)
- Strong Buy Zone (60–100)
And the line… tells the whole story.
Why it matters: Most indicators only give you the “now.” This one gives you the trend, which is 10x more valuable.
- Trend Confirmation:
When the line pushes out of the 40–60 Neutral Zone and climbs into the Strong Buy Zone, you’re seeing real, data-backed market momentum — not some influencer’s hot take. - Predictive Context:
Month 7 was the moment. That’s when the index crossed 60. That’s the early signal most investors miss — the point where smart money quietly enters. And as the line approaches the top of the Strong Buy Zone, investors can start planning the exit window before momentum cools.
Bottom line: This chart turns the Buy/Sell Index from a “cute indicator” into a market timing weapon.
AI can nail the timing because it’s watching the market like a hawk. It tracks supply, demand, price momentum, interest rates, listing behavior, investor activity—basically every signal humans miss until it’s too late
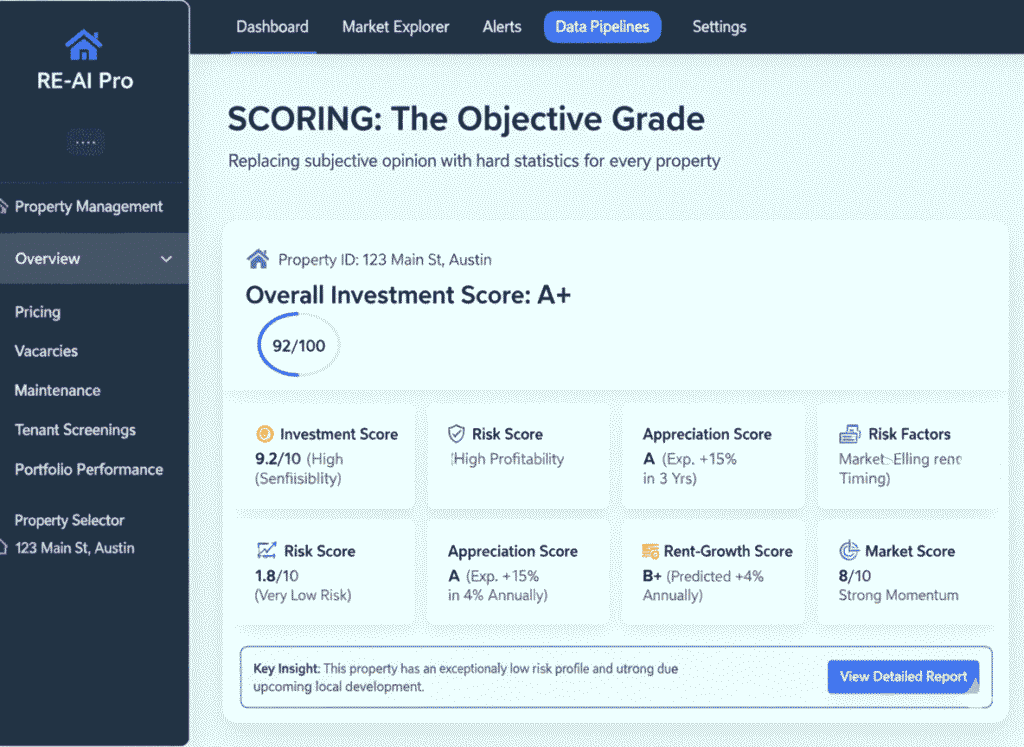
Step 4: Scoring
After analyzing everything, the AI assigns a clear, quantifiable grade to the property and the deal itself. This replaces subjective opinion with hard statistics.
Every property gets a suite of objective scores:
- Investment Score: Overall profitability and viability.
- Risk Score: Probability of failure or underperformance.
- Appreciation Score: Expected price growth over the next 3/5/10 years.
- Rent-Growth Score: Predicted increase in rental income.
- Market Score: Overall health and momentum of the submarket.
You get a clear, digestible summary of the deal’s performance potential, instantly.
How AI Scores Deals?
Radar Chart: The AI Deal Scorecard
If you want investors to instantly understand a deal’s strengths and weaknesses, nothing beats a Radar Chart. This thing works like a “deal fingerprint.” Every spike shows strength. Every dip shows risk. And every shaded shape tells a story faster than a paragraph ever could.
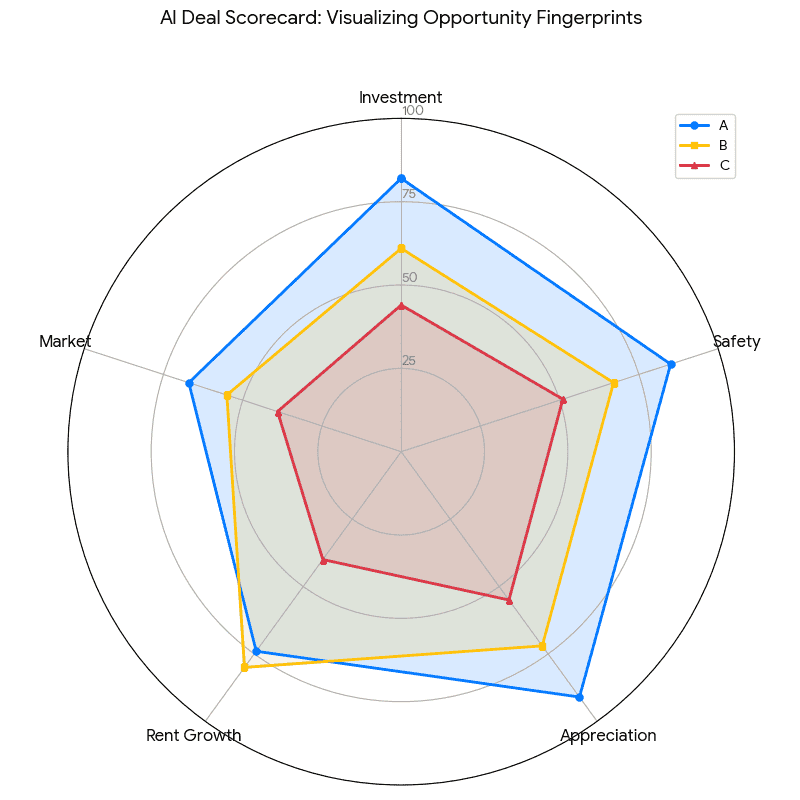
Here’s what it reveals:
- Deal A dominates the entire chart — wide spread, strong shape, massive upside in Appreciation and Investment. This is the kind of pattern every investor wants to see before wiring money.
- Deal C shrinks into the center — a tight, compressed shape that screams: “Proceed with caution. High risk. Low reward.”
- Deal B sits in the middle — decent potential but not a standout.
By flipping the Risk Score into a Safety Score (100 − Risk), the whole visual becomes even clearer. The bigger the shape, the better the deal. The smaller the shape, the faster you should walk away.
Heatmap Score Matrix: The Institutional Investor Vibe
If the Radar Chart shows you one deal’s “fingerprint,” The Heatmap shows you the entire portfolio’s DNA.
Fund managers love this thing because it lets them compare multiple deals across multiple metrics in one glance—no scrolling, no spreadsheets, no mental gymnastics. Just pure, visual clarity.
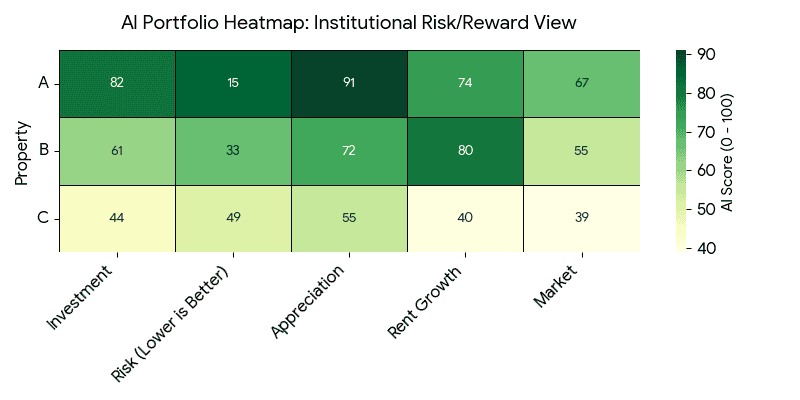
Here’s the magic:
- Rows: Properties A, B, and C
- Columns: Investment, Risk, Appreciation, Rent Growth, Market
- Color: The darker the green, the stronger the deal. The lighter the tone, the more you should squint and reread the numbers.
And the story becomes obvious instantly:
- Property A glows deep green across the board.
High scores. Low risk. A textbook institutional-grade opportunity. - Property B is solid—but not elite.
Great Rent Growth, good Appreciation, mixed elsewhere. - Property C?
A lot of pale yellow.
Translation: “This one needs a miracle to grow.”
You’re not reading your way to a conclusion—the heatmap forces the truth into your eyeballs.
It’s fast. It’s visual. It’s impossible to misinterpret.
Step 5: Results
The last step is delivering the results in a format you can actually use. No raw code, just clear, actionable recommendations.
Your dashboard gives you:
- Best Deals: Top-ranked properties with the highest Investment Score.
- Worst Deals: Clear warnings on properties to avoid.
- Future Performance Projections: Automated 5-year expected cash flow statements.
- Risk Warnings: Specific alerts (e.g., “Flood risk probability is 18% higher than average”).
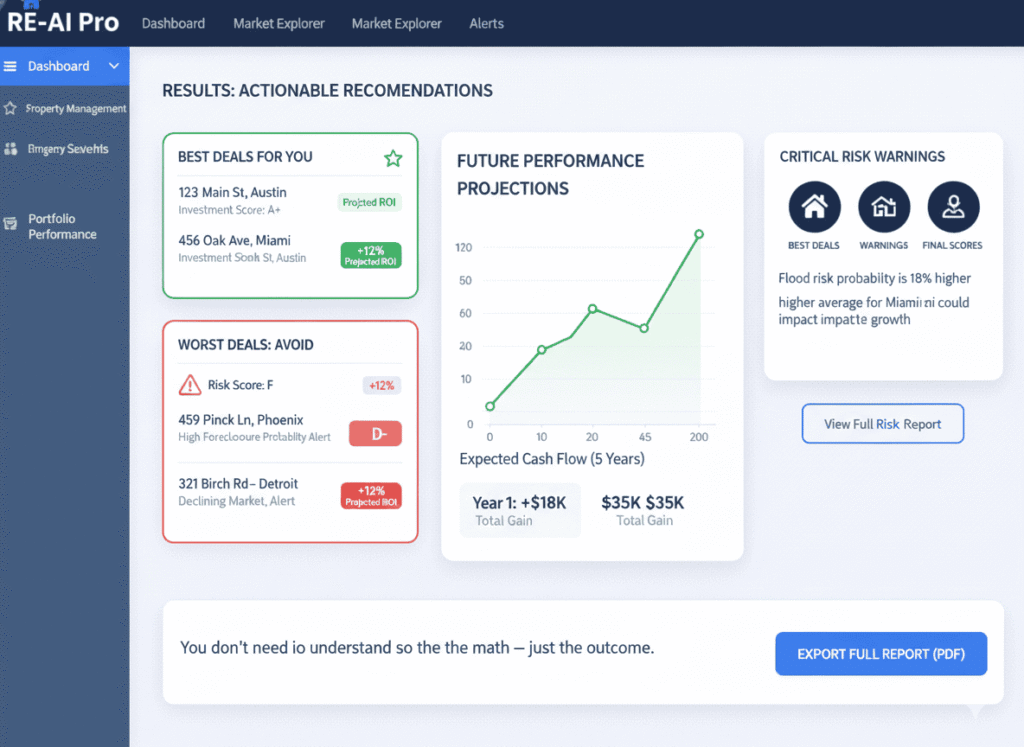
The whole purpose of the system is to give you a “cheat sheet“ for high-stakes decision-making.
What Investors Actually Care About?
This is where the real value is for the investors.
Deal Discovery
Real estate investing is a sourcing game. Your return is often determined the second you buy, not the moment you sell. If you can find a better deal than everyone else, you win. It’s that simple.
This chart is the closest thing you’ll ever get to seeing AI think. It shows exactly where the algorithm finds opportunities that 99% of investors miss — not because they’re bad at their job, but because humans simply can’t scan thousands of micro-signals at once.
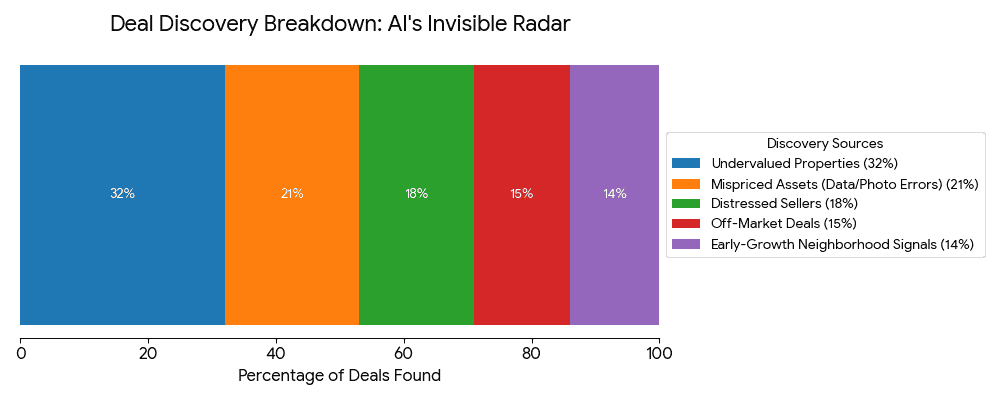
Here’s the weightage of the winning deals AI can discover for you:
Undervalued Properties (32%) — The Instant-Equity Jackpot. This is where AI flexes hardest.
The model runs a true mass appraisal on every listing, catching micro-level value triggers (renovation quality, zoning adjacency, hyper-local comps) that traditional MLS data completely ignores. This is how AI finds the “$40k-underpriced gem” everyone scrolls past.
Mispriced Assets (21%) — The Human-Error Arbitrage. Bad photos. Messy data. Wrong room counts. AI’s computer vision and NLP spot listing errors that make good properties look bad. While humans skip these listings without thinking, AI circles them like a shark smelling blood.
Distressed Sellers (18%) — The Early-Warning Radar. This is where predictive analytics feels borderline unfair. AI picks up signals in public records — tax delinquencies, code violations, probate filings — weeks or months before the market wakes up. It’s like getting tomorrow’s motivation from sellers… today.
Off-Market Deals (15%) — The Stealth Mode Advantage. Forget waiting for MLS. AI predicts who’s likely to sell before the property is listed. This is the secret weapon investors use to land private deals while everyone else is refreshing Zillow.
Early-Growth Neighborhoods (14%) — The Appreciation Crystal Ball. The model analyzes leading indicators like new business permits, infrastructure upgrades, and migration trends. By the time the news covers a “hot neighborhood,” AI flagged it months ago — when prices were still negotiable.
The deal you’d spend weeks hunting for? AI finds it in seconds. The Speed advantage.
Risk Reduction
Investors don’t lose money because of bad markets; they lose money because of bad assumptions. Relying on gut feel or lagging data is a recipe for disaster.
Your AI’s primary job isn’t to find you a deal; it’s to stop you from buying a terrible one. Predictive analytics gives you a complete risk profile of each deals on a heatmap graph-
- Downside Risk: Shows your true worst-case loss.
- Rent Volatility: Predicts rental income swings before they hit your cash flow.
- Neighborhood Decline: Flags early signs of area downturns so you can act fast.
- Vacancy Probability: Forecasts future vacancies with high accuracy for realistic pro formas.
- Price Corrections: Highlights where local prices are likely to dip before the market reacts.
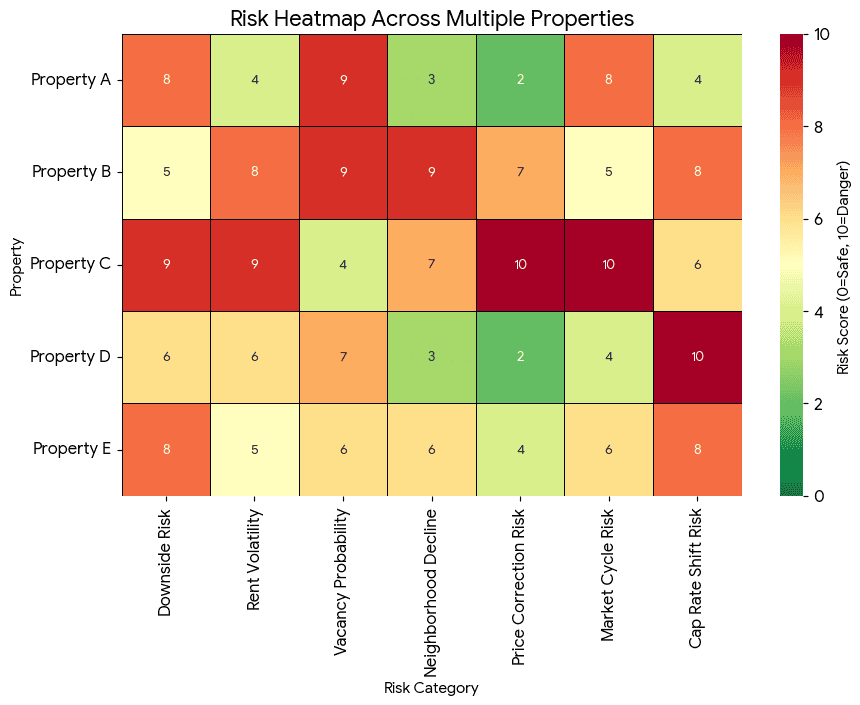
The heatmap uses a color-coded scale:
- Green: Low Risk (Safe)
- Yellow: Moderate Risk (“Don’t touch without a discount”)
- Red: High Risk (Danger)
Interpretation:
- Property C is clearly the riskiest overall, scoring the maximum 10 in both Price Correction Risk and Market Cycle Risk (deep red cells).
- Property A is highly vulnerable to Vacancy Probability (9) and Downside Risk (8), but is very safe regarding Price Correction Risk (2) and Neighborhood Decline (3).
- Property D has a major weakness in Cap Rate Shift Risk (10) but is otherwise stable, especially in Price Correction Risk (2).
Accurate Price & Rent Forecasting
The AI generates a complete, forward-looking financial trajectory for every asset, making complex decisions simple:
- Property Value Forecasting: Predicts 12–36-month price trends with 75–88% accuracy in stable markets. Zillow’s Zestimate achieves a 5.9% median error, proving real-world precision.
- Rental Income Projections: Forecasts rents and occupancy with 80–92% accuracy over 12 months, and 90–94% accuracy for 36-month rent growth based on demographics, jobs, and inventory.[1]
- Market Timing: Spots market-cycle turning points 3–6 months earlier than lagging indicators like median prices.
- Neighborhood Evolution: Identifies rising or declining neighborhoods with 70–85% accuracy using demographic, permitting, and business-growth signals.
- Investment Risk Assessment: Evaluates volatility, liquidity, and economic sensitivity to deliver risk profiles far more accurate than traditional analysis.
- NOI Stability: Predicts the stability of Net Operating Income under changing expenses and vacancies — critical for cash-flow-driven investors.
- Cap Rate Changes: Forecasts future cap-rate movement so underwriting reflects tomorrow’s value, not just today’s.
- Cash-Flow Performance: Produces automated, year-by-year pro forma cash-flow statements — eliminating manual spreadsheet assumptions.
Faster Underwriting
In real estate, speed is money. The investor who analyzes a great deal in 40 seconds will always beat the investor who takes 3 hours to run the same numbers. It’s an issue of basic math: More deals analyzed = more profitable deals found.
Here is the specific, time-consuming work the AI accelerates and automates:
- Comps Analysis: Instantly gathers and adjusts hundreds of comparable sales (comps) that accurately reflect the property’s true value, saving hours of manual filtering.
- Financial Modeling: Automatically builds and runs dynamic pro forma models, factoring in your target leverage and expense assumptions in real-time.
- Rent-Roll Breakdown: Immediately processes complex rent rolls, flagging inconsistencies, vacancy risks, and tenant payment patterns.
- Market Scoring: Generates an objective performance score for the submarket, removing subjective local bias.
- Property Risk Checks: Simultaneously runs all necessary checks (flood zones, environmental hazards, tax liens) and bundles the findings.
Underwriting that took 3 hours now takes 40 seconds. Your competition is still on their first coffee break while you’ve already analyzed and ranked a dozen new deals. This productivity jump is your most significant competitive edge.
Competitive Edge
Real estate is a zero-sum game. For every profitable deal you win, someone else loses. For every great property you buy, a dozen investors wish they had your data.
Predictive analytics isn’t just a tool for optimization—it’s a weapon that ensures you’re playing a different, faster, and smarter game than everyone else in your market. It’s the difference between trailing the market and defining it.
The AI eliminates the competition by giving you the absolute edge where it matters most:
- Real-Time Market Signals: Instant alerts when key variables shift — you never get blindsided.
- First-Mover Advantage: Spot and score deals before anyone else — you see the deal first.
- Faster Decisions: Underwrite in seconds and submit offers while others are still modeling — you lock up the deal.
- Stronger Negotiation Power: Know true value, downside risk, and seller motivation — you buy at a lower price.
- Hidden Opportunities: Discover off-market and mispriced assets others never see — you play in an exclusive field.
Suggested reading: AI in real estate and use cases, benefits, and future trends
What AI Can’t Predict
Black Swan Events: Pandemics, disasters, policy shocks — anything with no historical precedent stays unpredictable.
Property-Specific Quirks: Unique layouts, renovation quality, or buyer tastes can make individual properties behave differently from the model.
Exact Timing: AI predicts direction and magnitude, not “values will rise 1.2% next month.”
Regulatory Moves: Zoning changes and political decisions remain beyond perfect forecasting.
Human Behavior: Personal motivations — when someone sells, what they offer, how they negotiate — can’t be fully modeled.
Understanding Confidence Levels
Quality predictive systems not only provide predictions but also indicate confidence levels. High confidence generally correlates with high accuracy.
High Confidence (80%+): Short-term (6–12 months), stable markets, data-rich environments.
Medium Confidence (65–80%): 12–24 months or markets with limited data.
Low Confidence (50–65%): 24+ months, emerging areas, or high volatility.
Example:
- Property A: $385K in 12 months (82% confidence)
- Property B: $425K in 18 months (58% confidence)
Choose based on your risk tolerance, not just the upside.
Factors That Affect Prediction Accuracy
Data Quality: The cleaner, richer, hyper-local data you have, the sharper the prediction. Sparse data = fuzzy forecasts.
Market Stability: Stable markets behave predictably. Volatile markets don’t care about your models.
Time Horizon: The further out you predict, the more reality drifts. Six-month forecasts? Solid. Thirty-six-month forecasts? Much shakier.
External Shocks: Recessions, policy shakeups, disasters — anything that breaks historical patterns instantly breaks prediction accuracy.
Example: If Nashville was forecast to grow 12–15% over 18 months, a sudden recession or pandemic can cut that to 6–8%, not because the model was wrong — but because reality changed the script.
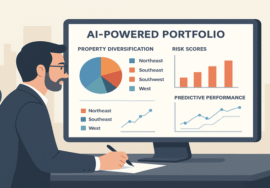
Predictive Analytics Applications in Real Estate
AI-driven tools are revolutionizing portfolio management by enabling real-time adjustments based on predictive insights. This approach enhances risk prediction and portfolio optimization, allowing investors to proactively manage risks and optimize returns.
1. Smarter Deal Selection
- Spot undervalued vs. overvalued properties instantly.
- Rank deals by future appreciation—based on real neighborhood signals, not guesses.
- Get risk-adjusted return forecasts that reveal the real winner.
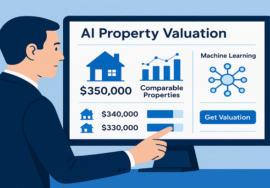
Example: Two $350K homes look identical—AI shows one has 18% upside, the other only 6%. Decision made.
2. Perfect Market Timing
- Detect market peaks before everyone else starts panicking.
- Identify market bottoms when opportunities are cheapest.
- Use seasonal patterns to buy low and sell high.
Example: Early 2022 Phoenix? AI flagged the correction months before prices dropped 12–15%.
3. Real Risk Management
- Quantify downside risk for every deal.
- Measure liquidity risk so you know how fast you can exit.
- Spot portfolio concentration risks you never knew existed.
- Stress-test assets against recessions, rate shocks, or local job losses.
4. Predicting Renovation ROI
- Know which upgrades actually pay off in that neighborhood.
- Compare renovation costs vs. predicted value gains.
- See upcoming buyer preferences before they show up in the comps.
Example: Kitchen upgrade boosts rents +18%; bathroom only +7%—easy choice.
5. Rental Demand & Income Forecasting
- Predict occupancy rates with high accuracy.
- Set the perfect rental price using real-time demand signals.
- Forecast future tenant demographics to shape your strategy.
- Catch demand shifts—like home office needs—before competitors do.
6. Portfolio Optimization
- Identify the best markets for geographic diversification.
- Get AI-driven asset allocation guidance for stronger returns.
- Know exactly when to sell, rebalance, and redeploy capital.
- Build long-term growth strategies based on future—not past—market cycles.
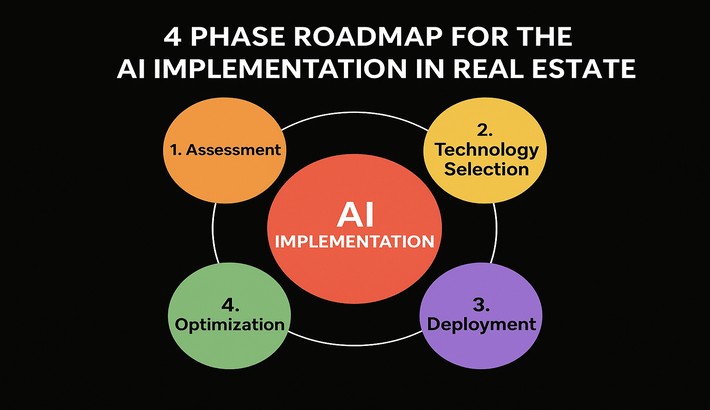
Implementation Guide for Investors
Predictive analytics isn’t “install a tool and hope for the best.” It’s a full upgrade to how you invest. Here’s the no-fluff roadmap.
Phase 1: Strategy & Blueprint (Weeks 1–2)
- Audit your current process → find bottlenecks, blind spots, and ROI leaks.
- Define crystal-clear goals (market timing, deal scoring, risk modeling).
- Map the tech stack so the custom AI plugs in cleanly.
- Build your team’s literacy so everyone trusts the new system.
Phase 2: Custom Build & Validation (Weeks 3–6)
- We architect your custom prediction engine—no generic models.
- Test it against your real historical deals to verify accuracy.
- Roll it out in stages so your team masters the basics first.
- Train your team on the model logic and explainability.
Phase 3: Integration Into Your Workflow (Weeks 7–12)
- Wire the AI directly into your sourcing and underwriting pipeline.
- Create a verification protocol (AI + human diligence working together).
- Add prediction auditing to track accuracy over time.
- Build a decision framework so confidence scores guide real actions.
Phase 4: Optimization & Long-Term Edge (Weeks 13+)
- Continuous performance reviews and model retraining.
- Tune strategy based on real-world outcomes.
- Add advanced modules (scenario modeling, portfolio risk simulations).
- Ongoing partnership to keep your predictive edge sharp.
Your Success Metrics
- Better Deals: Higher accuracy between forecasts and real outcomes.
- Faster Decisions: Hours saved per deal → faster offers → more wins.
- Higher Returns: AI-vetted assets outperform your old benchmarks.
- Lower Risk: Fewer bad buys and better market timing.
- More Confidence: A faster, clearer, more decisive investment team.
Common Mistakes to Avoid
AI won’t eliminate risk—but it will eliminate bad decisions… if you avoid these traps.
1. Blindly Trusting Predictions: Thinking AI gives certainties is how investors get wrecked. AI spots patterns—you still need judgment. Use the prediction as the first filter, not the final answer. Example: A model shows +20% appreciation. Confidence is only 62%. Market shifts. You get 11%. The AI wasn’t wrong—you just didn’t read the fine print.
2. Ignoring Confidence Scores: An 85% confidence prediction ≠ a 55% one. Treat them differently.
High confidence = act fast.
Low confidence = dig deeper.
3. Feeding the Model Garbage Data: Bad data in → bad predictions out. MLS errors, missing tax data, biased comps… all poison the model. Fix your pipeline before you brag about your AI.
4. Forgetting Local Knowledge, Still Wins: AI can’t see that the city council hates new development… but the locals do. Blend data + boots-on-the-ground intel for the real edge.
5. Treating AI as a Deal Tool, Not a Strategy Tool: Predictions aren’t just for “this one deal.” Use them to shape portfolio strategy, market timing, and allocation.
6. Ignoring Scenarios: Don’t just look at the “most likely.” Understand the best case, worst case, and WHY they happen. Downside planning is half the game.
7. Not Tracking Performance: If you’re not measuring how accurate predictions were…you’re not learning—you’re guessing. Track them. Tune them. Get sharper over time.
8. Buying Too Many Tools: More tools ≠ more clarity. Often, it’s just more confusion. Master ONE solid predictive engine before adding anything else.
The Future of Predictive Analytics in Real Estate
Real-Time Predictions (2025–2026): Monthly updates are dead. Forecasts will update live—every price cut, inventory shift, or economic headline instantly reshapes your prediction. You get alerts the moment the market turns, not three weeks later.
Climate-Risk Intelligence (2025–2027): Flood zones, wildfire risk, rising insurance costs—AI will bake all of it directly into your valuations. You’ll spot climate-safe buys before they become overpriced… and avoid the ticking time bombs everyone else is ignoring.
Alternative Data Superpowers (2026–2028): Satellite images, foot-traffic data, neighborhood sentiment, credit-card spend—yeah, that’s all becoming part of your deal analysis. It catches trends before they show up in MLS or census data. (Yes, privacy rules will be a thing. Stay compliant.)
Quantum-Powered Predictions (2028–2030): Imagine 18–24 month forecasts with 90%+ accuracy. Quantum computing makes that possible—processing thousands of variables at once. It’s early, but pilot programs are already happening. Early adopters = unfair advantage.
Personalized Forecast Engines (2026–2029): Your AI won’t just predict markets—it will predict for you. Your strategy, your risk tolerance, your timeline. It learns how you invest and adapts every forecast to match your style. No more generic predictions… only tailored intelligence.
Takeaways:
- Predictive analytics is the new unfair advantage — while others study last quarter, you see the next quarter.
- It delivers 82–91% accuracy, flags market shifts 3–6 months early, and cuts bad deals by 60–70%.
- This isn’t magic. It’s pattern recognition at scale — like switching from paper maps to GPS.
- Early adopters win big: many see 200–400% ROI in the first year because they move faster and smarter.
- The smartest investors blend AI with experience — the data spots patterns, the human makes the call.
- Stick with it for 90 days, and you’ll make quicker, more confident decisions — and notice opportunities others completely miss.
- The market won’t wait. Every day you delay, someone else is using predictive analytics to get ahead of you.
Start now. Test. Learn. Act. The advantage goes to the investor who moves first.
Frequently Asked Questions (FAQs)
Q: How accurate is predictive analytics for real estate investing?
A: Very—when the data is good. 6–12 month forecasts hit 82–94% accuracy, 12–24 months drop to 72–82%, and anything beyond 24 months depends on how crazy the market gets.
Q: What’s the difference between predictive analytics and automated valuation models (AVMs)?
A: AVMs tell you “What’s it worth of a house today?” Predictive analytics tells you “What will it be worth in 18 months—and why?” One is a snapshot. The other is a roadmap.
Q: Can predictive analytics predict market crashes or major downturns?
A: It can spot warning signs months before they show up in headlines—inventory spikes, affordability drops, buyer sentiment shifts. But black-swan events? Nope. No model predicted COVID either.
Q: Do I need technical skills or data science knowledge to use predictive analytics?
A: Nope. If you know cap rates and cash flow, you’re good. Most tools are point-and-click simple, and it usually takes 2–4 weeks to get comfortable.
Q: How long before I see ROI from predictive analytics investments?
A: Most investors see meaningful ROI in 6–12 months—either through better deals or avoiding bad ones.
One prevented mistake can pay for the tool for years.
Q: How do I know if a prediction is reliable enough to base investment decisions on?
A: Look at:
- Confidence score (75%+ is solid)
- Timeframe (shorter = more accurate)
- Data quality in that market
- Consistency across multiple signals
Use predictions as your first filter, not your final verdict.
References:
- Getting ahead of the market: How big data is transforming real estate
- Effect of Outliers on Real Estate Valuation with Machine Learning
- Real Estate Climate Risk

Kamlesh Mandloi is a data scientist and AI architect with over 10 years of experience helping businesses overcome industry bottlenecks through the application of technology.