AI-Powered Real Estate Market Forecasting: Trends for 2025 and Beyond
The $2.4 Million Choice: An Illustrative Case Study
The story of Thomas Bradford and Maya Chen is fictional, crafted to illustrate how AI-driven forecasting outperforms traditional methods using real 2023–2024 market data.
It was supposed to be the deal of a lifetime.
In the first quarter of 2023, veteran real estate investor Thomas Bradford purchased an apartment complex in Austin, Texas. Everything looked perfect on paper: strong rental history, growing population, and rising property values—a consensus view based on historical trends.
By the end of 2024, the property’s value had dropped significantly.
What happened? Thomas had relied on the same forecasting methods that had served him for two decades—looking at lagging indicators: Talking to local brokers, and trusting his gut instinct.
What he missed was the perfect storm predicted by leading indicators: accelerating tech layoffs, a sharp interest rate hike cycle, and an unprecedented surge in new apartment supply.
Meanwhile, across town, a hypothetical investor named Maya Chen executed a similar transaction. The difference was Maya used AI-powered market forecasting.
Her system predicted the market bifurcation six months before it was apparent, identifying which submarkets were fundamentally resilient (hers) and which were facing supply saturation (Thomas’s).
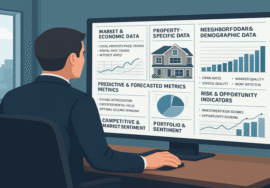
Her system achieved this by analyzing 500+ dynamic variables that human analysts simply cannot process simultaneously: employment patterns, construction permit data, demographic shifts, and interest rate sensitivity.
This is not a story about luck. It’s about the revolution in real estate market forecasting—and why mastering AI prediction is now the critical competitive advantage.
Welcome to the future of real estate forecasting, where artificial intelligence doesn’t just analyze past trends—it predicts future outcomes with a level of accuracy that would have seemed impossible just five years ago.
For a broader overview of how AI is transforming every aspect of property investment and management, explore our comprehensive guide: AI in Real Estate: Use Cases, Benefits, and Future Trends (2025)
Why Traditional Forecasting Is Failing Investors
The real estate market has become too complex for human-only analysis to predict accurately.
The Exponential Complexity Problem
According to McKinsey & Company’, “Getting Ahead of the Market: How Big Data Is Transforming Real Estate”, the number of variables influencing property values has expanded dramatically over the past two decades.
Once limited to traditional metrics such as comparable sales or neighborhood demographics, today’s predictive models analyze hundreds of interconnected data points — from mobility patterns and energy usage to sentiment analysis and zoning activity.
Traditional forecasting methods, which rely primarily on historical trends and expert judgment, can only account for a limited set of these variables at a time. This highlights why AI-driven analytics have become essential for modern valuation accuracy, capable of integrating and learning from hundreds of factors simultaneously.
According to cross-industry real estate research, today’s market outcomes are influenced by interconnected factors such as:
- Employment trends across 15+ industry sectors
- Remote work adoption rates by company size and type
- Interest rate trajectories and financing availability
- Construction pipeline timing and absorption rates
- Demographic migration patterns and household formation
- Infrastructure development and transportation changes
- Climate risk and insurance cost trajectories
- Technology disruption affecting property types
- Regulatory changes and zoning updates
- Social sentiment and lifestyle preference shifts
The human brain cannot process this complexity effectively. We fall back on simplified mental models, recent experiences, and cognitive biases—leading to systematically flawed predictions.
The Lagging Indicator Trap
Traditional forecasting relies heavily on lagging indicators—data that tells you what already happened, such as last quarter’s sales prices, last month’s inventory levels, or last year’s population growth. By the time these indicators show clear trends, markets have often already shifted. Predictive analytics, by contrast, can detect early signals from leading indicators — like mortgage pre-approvals, search interest, or inventory surges — giving investors a crucial edge.
Real Example: The Austin, Texas Housing Market (2022)
In early 2022, Austin’s housing market was still showing record-breaking strength — median home prices were near historic highs, and homes were selling quickly, often at significant premiums. A human investor relying solely on lagging indicators would have seen little reason for caution.
However, the underlying data told a different story:
- Rising Inventory: New construction permits and active listings surged, signaling increasing supply.
- Affordability Pressure: Rapid interest rate hikes by the Federal Reserve in spring 2022 quickly reduced buyer affordability, putting downward pressure on demand.
By May 2022, Austin’s median home price had peaked at $667,050, marking a turning point in the local housing market (Newsweek, 2022). This combination of supply and affordability signals highlighted the changing market dynamics months in advance — a scenario where predictive analytics could help investors anticipate inflection points before they became obvious to traditional methods.
The Single-Market Myopia
Most investors focus deeply on 1-3 markets where they have experience and relationships. This concentrated expertise is valuable but creates blind spots to opportunities and risks in other markets.
AI-powered forecasting analyzes hundreds of markets simultaneously, identifying:
- Emerging markets before they become expensive and competitive
- Declining markets before problems become obvious in pricing
- Correlation between markets that appear independent but actually move together
- Geographic arbitrage opportunities traditional analysis misses
According to PwC’s Emerging Trends in Real Estate 2025 report, investors are increasingly leveraging advanced analytics to navigate the complexities of the real estate market.
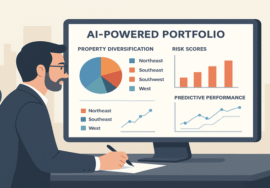
AI-driven multi-market analysis is now viewed as an indispensable strategy for achieving superior portfolio diversification and timing opportunities that single-market specialists may miss.
The Cognitive Bias Epidemic
Human forecasters suffer from systematic cognitive biases that distort predictions:
Recency Bias: Overweighting recent events (if market rose last quarter, expecting it to keep rising) Confirmation Bias: Seeking information supporting existing beliefs while ignoring contradictory data Anchoring Bias: Over-relying on initial information (original asking price, past comparable sales) Availability Bias: Overweighting easily remembered information versus comprehensive data analysis Overconfidence Bias: Believing our experience makes us better forecasters than data suggests
These biases are hardwired into human thinking. We can’t simply “try harder” to overcome them. We need systems—like AI—that process data objectively without emotional attachment to specific outcomes.
The Speed Deficit
Markets move faster than human analysis allows. Consider a typical forecasting scenario:
Traditional Approach (4-6 weeks):
- Week 1: Gather historical data and market reports
- Week 2: Analyze trends and identify patterns
- Week 3: Interview local experts and brokers
- Week 4-6: Synthesize information and develop a forecast
By the time your traditional forecast is complete, the market has already changed. New listings appeared, economic data were released, competitive dynamics shifted, and interest rates moved.
AI-Powered Approach (2-3 hours):
- Minutes 1-30: Automated data aggregation from 200+ sources
- Minutes 31-90: Pattern analysis across 500+ variables
- Minutes 91-120: Forecast generation with confidence levels
- Real-time updates: Continuous refinement as new data emerges
The speed advantage isn’t just convenient—it’s competitive. In fast-moving markets, the investor who forecasts accurately and quickly wins. The investor who forecasts slowly, even if eventually accurate, loses opportunities to faster competitors.
What Is AI-Powered Market Forecasting?
Think of AI-powered market forecasting as having a team of 200 analysts working 24/7—each monitoring different aspects of real estate markets—combined with a supercomputer that identifies patterns across decades of data that humans would never spot.
Except this system never gets tired, never misses a correlation, processes information thousands of times faster than human teams, and costs a fraction of what traditional analysis requires.
For deeper insights into how AI is enhancing commercial property valuations, see our article on AI in Commercial Real Estate: CRE Market Insights, Forecasting & Valuations
The Core Components Simply Explained
Massive Data Aggregation
AI systems automatically collect and organize information from hundreds of sources continuously:
- Transaction databases with decades of historical sales
- MLS listings and pricing data updating in real-time
- Economic indicators: employment, GDP, consumer confidence, wage growth
- Demographic data: population shifts, household formation, age distributions
- Construction data: permits, starts, completions, pipeline analysis
- Infrastructure: transportation projects, development plans, zoning changes
- Interest rates and financing: mortgage rates, credit availability, lending standards
- Social data: search trends, sentiment analysis, migration patterns
- Climate data: weather patterns, disaster risk, insurance costs
- Technology trends: remote work adoption, industry disruption, space utilization
Traditional forecasting might consider 10-15 of these factors manually. AI processes all simultaneously and continuously.
Pattern Recognition Across Time and Space
Machine learning algorithms analyze this massive dataset, identifying patterns that predict future outcomes:
- How changes in tech employment correlate with housing demand 18 months later
- Which combinations of factors precede market corrections
- How infrastructure projects affect property values in 2-5 year timeframes
- What leading indicators predict market turning points 6-12 months ahead
- Which demographic shifts drive demand in different property types and locations
Simple analogy: Just like how Netflix predicts what show you’ll enjoy based on patterns from millions of viewers, AI predicts market movements based on patterns from thousands of historical market cycles and millions of transactions.
How AI Forecasting Differs from Traditional Methods
Traditional Real Estate Forecasting:
- Manual data gathering taking days or weeks
- Analysis of 10-20 key metrics
- Predictions based on linear trend extrapolation
- Quarterly or annual forecast updates
- Single-point predictions (“market will grow 8%”)
- Limited geographic scope
- Reactive adjustments after market changes
AI-Powered Forecasting:
- Automated data collection happening continuously
- Analysis of 500+ relevant variables
- Predictions based on complex pattern recognition
- Real-time forecasting with continuous updates
- Probability-weighted scenarios (“70% chance of 6-10% growth, 20% chance of 3-6% growth, 10% chance of flat to negative”)
- Multi-market analysis across hundreds of regions
- Proactive predictions before market shifts occur
AI: The New Benchmark for Predictive Accuracy
AI has set a new benchmark for predictive accuracy, moving beyond the inherent limitations of traditional, human-driven forecasting.
The true transformative power lies in advanced analytics, which combine vast, diverse datasets—incorporating both conventional metrics and non-traditional factors—to uncover hidden market relationships. This capability leads to predictions with significantly higher certainty.
For example, machine-learning models were used to forecast key indicators like the three-year rent per square foot for multifamily buildings in Seattle. These AI-driven models achieved an accuracy rate that exceeded 90%, providing a clear and decisive performance advantage over older forecasting methodologies, according to research from McKinsey & Company.
How AI Forecasting Actually Works
Imagine you’re considering investing in Nashville real estate. Here’s how AI transforms the forecasting process:
Traditional Forecast (3-4 weeks): You research recent sales (up 12% last year), talk to local brokers (optimistic), review employment growth (strong), check inventory (tight), and project forward based on these factors. Your forecast: Nashville will continue appreciating 10-12% annually.
AI-Powered Forecast (2 hours): The system analyzes:
- 15 years of Nashville transaction data identifying cyclical patterns
- Current construction pipeline: 18,000 units delivering over next 24 months
- Employment data across 20 sectors showing tech slowdown but healthcare acceleration
- Demographic analysis showing millennial household formation peaking
- Interest rate sensitivity analysis for Nashville buyer profiles
- Comparable market cycles in similar cities predicting trajectory
- Infrastructure impact from new transit developments
- Remote work data affecting demand patterns by neighborhood
AI Output:
Nashville 24-Month Forecast (Generated September 2025)

Base Case (65% probability): 4-7% appreciation
- Supply absorption: 14-16 months
- Employment growth: Moderate (2.1-2.8%)
- Interest rate impact: Moderate demand suppression
- Key driver: Healthcare sector growth offsetting tech slowdown

Bull Case (20% probability): 8-11% appreciation
- Requires: Faster supply absorption + stronger employment
- Key trigger: Major corporate relocations or tech recovery

Bear Case (15% probability): Flat to -3%
- Risk factors: Supply oversaturation + economic slowdown
- Key trigger: Recession or accelerated tech sector decline

Optimal Entry: Q2-Q3 2026 when supply peaks and pricing adjusts
Submarkets to Watch: Healthcare corridor (strongest), Downtown (moderate risk)
This probabilistic, nuanced forecast reflects market complexity far better than traditional single-number predictions. It also updates continuously as new data emerges rather than becoming stale after publication.
How AI Predicts Real Estate Markets
Understanding the prediction methodology of AI helps investors trust AI insights while maintaining appropriate skepticism while investing in real estate.
Step 1: The Detective Work—Uncovering Hidden History
AI starts by examining decades of market history, looking for patterns that repeat themselves. It’s not guessing; it’s connecting cause and effect across thousands of cycles.
- The Discovery: AI finds rules like: “When employment growth in tech hits X% at the same time inventory is Y, prices historically jump 10%.”
- The Power: These aren’t theories—they are statistical facts discovered in the data. When the market conditions today match a powerful historical pattern, the AI can forecast the outcome with a specific, quantifiable probability. It knows the playbook because it’s read every game tape.
Step 2: The Maestro—Orchestrating Complex Variables
A human analyst can juggle maybe five variables; an AI can handle hundreds. This is where traditional forecasting falls apart and AI truly shines. It identifies how factors don’t just add up, but how they multiply and interact.
- The Breakthrough: AI finds links humans miss: Does remote work always hurt city centers? No. AI sees the impact changes based on specific factors like the city’s walkability, climate, or cultural amenities.
- The Insight: It understands that the impact of a rising interest rate is completely different for a first-time homebuyer than it is for a luxury investor, and it weights these effects simultaneously to predict true market pressure.
Step 3: The Navigator—Ignoring the Noise, Finding the Signal
Most real estate headlines focus on lagging indicators—data that confirms what happened six months ago (like the median sale price). AI focuses on leading indicators—the whispers that predict the future.
| AI Prioritizes (Leading Indicators) | Humans Focus On (Lagging Indicators) |
| New Building Permits (Future Supply) | Closed Transaction Volume (Past Sales) |
| Job Posting Trends (Future Demand) | Historical Appreciation Rates (Old News) |
| Mortgage Application Volumes (Immediate Buyer Intent) | Published Market Reports (Already priced in) |
The Advantage: By emphasizing leading indicators like job postings and construction starts, AI gives investors an advance warning of market shifts, not just confirmation after the train has left the station.
Step 4: The Risk Manager—Embracing Uncertainty with Scenarios
The market is never certain. A traditional analyst gives you one number and hopes for the best. AI is smarter: it gives you a probability-weighted forecast—a set of possible futures.
| Scenario for Your Target Market (12-Month Forecast) | Probability | The AI’s Logic |
| Optimistic Growth (7-10% up) | 25% | Driven by strong employment and stable rates. |
| Base Case (3-6% up) | 60% (Most Likely) | Steady growth with mild economic conditions. |
| Pessimistic (-4% to Flat) | 15% | Triggered only by recession or sharp rate hikes. |
The Value: This approach doesn’t promise a single winning lottery ticket. Instead, it allows you to make risk-adjusted decisions based on the most probable outcomes, preparing you for all possibilities.
Step 5: The Learner—Getting Smarter Every Single Day
Unlike a human modeler who moves on to the next project, the AI system never stops learning.
It continuously tracks its own forecasts against what actually happened in the market, analyzes its errors, and automatically adjusts its internal weightings. This makes the model more reliable with every passing quarter.
The result? The predictive advantage only widens over time. This continuous refinement means the gap between AI and human prediction is permanent, making AI the essential tool for any serious investor today.
The true power of AI in property valuation is its continuous learning from complex, non-traditional data. This significantly boosts accuracy: AI-augmented models from MIT’s Real Estate Innovation Lab can explain up to 89% of sale price variance by incorporating subjective visual and aesthetic elements.
Prediction Accuracy by Timeframe
Real-world AI forecasting accuracy based on industry research and platform performance:
Short-Term Forecasts (6-12 months):
- Market direction: 84-91% accuracy
- Price range predictions: Within ±8% of actual outcomes 82-88% of time
- Best for: Tactical investment timing, near-term opportunities
Medium-Term Forecasts (12-24 months):
- Market direction: 76-84% accuracy
- Price range predictions: Within ±12% of actual outcomes 74-82% of time
- Best for: Investment strategy development, market selection
Long-Term Forecasts (24-36 months):
- Market direction: 68-78% accuracy
- Price range predictions: Within ±18% of actual outcomes 65-75% of time
- Best for: Strategic planning, trend identification
Key Insight: Accuracy decreases with forecast timeframe length as variables and uncertainty increase. Use short-term forecasts for tactical decisions and long-term forecasts for strategic direction rather than precise timing.
We’ve previously covered how predictive analytics is redefining real estate investment decisions — read more in Predictive Analytics in Real Estate 2025: How AI Is Driving Smarter Investments
2025 Real Estate Market Predictions
AI-powered analysis reveals a bifurcated market in 2025—with clear winners and losers based on fundamental economic and demographic drivers.
National Market Overview for 2025
Base Case Prediction (68% probability):
- National median home price appreciation: 3.2-5.8%
- Transaction volume: Increase of 8-14% from 2024 levels
- Interest rate environment: Gradual decline to 5.5-6.2% by year-end
- Inventory levels: Moderate increase, improving from historic lows
- Key driver: Interest rate normalization, releasing pent-up demand
According to Deloitte’s Real Estate Predictions for 2025, this moderate growth scenario reflects economic stabilization after the volatile 2022-2024 period, with regional performance varying dramatically based on local fundamentals.
Top Performing Markets for 2025
Tier 1: High Growth Markets (Predicted 8-15% appreciation):
1. Raleigh-Durham, North Carolina
- Prediction: 10-14% appreciation
- Key Drivers: Tech sector expansion, strong university pipeline, corporate relocations, affordable relative to peers
- Risk Factors: Moderate supply increases, economic slowdown impact
- Confidence Level: 79%
2. Tampa-St. Petersburg, Florida
- Prediction: 9-13% appreciation
- Key Drivers: Continued migration from high-tax states, remote work destination, strong job growth
- Risk Factors: Insurance cost increases, climate concerns, supply pipeline
- Confidence Level: 74%
3. Nashville, Tennessee
- Prediction: 8-12% appreciation
- Key Drivers: Diversified economy beyond tech, healthcare sector strength, lifestyle attractiveness
- Risk Factors: Supply absorption challenges, past overheating correction risk
- Confidence Level: 71%
Tier 2: Moderate Growth Markets (Predicted 4-8% appreciation):
4. Austin, Texas (Market Recovery Story)
- Prediction: 5-9% appreciation after 2023-2024 correction
- Key Drivers: Tech sector stabilization, university talent pipeline, strong fundamentals
- Risk Factors: Supply overhang, remote work impact, past speculation correction
- Confidence Level: 68%
5. Phoenix, Arizona
- Prediction: 4-8% appreciation (post-correction recovery)
- Key Drivers: Business-friendly environment, retiree migration, manufacturing growth
- Risk Factors: Water concerns, extreme heat, insurance costs
- Confidence Level: 72%
Markets to Watch Carefully (Higher Risk)
Correction-Risk Markets:
San Francisco Bay Area
- Prediction: Flat to +3% (continued structural challenges)
- Concerns: Remote work reducing demand, high costs, regulatory environment, tech sector uncertainty
- Confidence Level: 76% for modest or flat growth
Seattle, Washington
- Prediction: 2-6% appreciation (below historical average)
- Concerns: Tech layoffs ongoing, high costs, homeless/crime perception issues
- Confidence Level: 69%
New York City
- Prediction: 3-7% appreciation (market dependent on economic strength)
- Concerns: Office-to-residential conversion impacts, high costs, policy uncertainty
- Confidence Level: 64%
Suburban vs. Urban Dynamics
AI analysis reveals continuing but moderating suburban advantage:
Suburban Markets: 5-9% predicted appreciation
- Remote work still supporting demand though peak passed
- School quality and space remaining priorities
- Affordability relative to urban cores sustaining advantage
Urban Markets: 3-7% predicted appreciation
- Return-to-office mandates supporting recovery
- Younger demographics preferring urban lifestyle
- Entertainment/dining experiences drawing residents back
- Full recovery from pandemic impact still 2-3 years away in many cities
Similar predictive trends are also reflected in the research conducted by leading real estate firms such as Fannie Mae, CoreLogic, J.P. Morgan, and others.
Emerging Trends Shaping 2025-2030
AI identifies five mega-trends that will reshape real estate markets over the next five years.
Trend 1: Climate-Driven Migration Acceleration
The Pattern AI Identifies: According to analysis of demographic data, insurance costs, and climate projections, AI forecasts significant population movement away from high climate-risk areas toward climate-resilient regions through 2030.
High-Risk Areas (Predicted population outflow):
- Coastal flooding zones (Miami, New Orleans, Houston low-lying areas)
- Wildfire-prone regions (California interior, parts of Colorado and Montana)
- Extreme heat zones (Phoenix, Las Vegas, parts of Texas)
- Hurricane corridors (Gulf Coast, Southeast coastal)
Climate Havens (Predicted population inflow):
- Great Lakes region (Buffalo, Rochester, Cleveland, Milwaukee)
- Pacific Northwest interior (Spokane, Boise)
- Upper Midwest (Minneapolis, Madison, Des Moines)
- Appalachian mid-elevation cities (Asheville, Knoxville)
Investment Implications: AI forecasts 15-25% property value premiums emerging in climate-resilient markets by 2028-2030 as migration patterns accelerate. Early investors positioning in climate havens before mainstream recognition will capture significant appreciation. Conversely, high-risk areas face 10-20% value discounts as insurance costs surge and buyer pools shrink.
McKinsey Validation: McKinsey & Company estimates that the combined physical and transitional risks of climate change will drive a historic, multi-trillion-dollar reallocation of capital across the economy, with significant implications for the real estate sector. This shift will redistribute property values, creating both asset impairment risks and opportunities for climate-resilient investments, which could become a $1 trillion market opportunity alone by 2030.
Trend 2: AI Integration Becoming Standard
The Transformation AI Predicts: By 2028, AI-powered tools will be standard in real estate transactions, fundamentally changing how properties are valued, marketed, and managed.
Key AI Applications Becoming Mainstream:
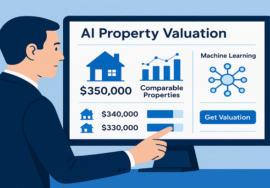
- Instant property valuations with 90%+ accuracy
- Predictive maintenance preventing costly repairs
- Automated tenant screening and lease management
- Dynamic pricing optimization for rentals
- Virtual property tours with AI-generated renovations
- Market timing recommendations for buying/selling
Competitive Divide: AI forecasts a two-tier market emerging:
- Tier 1: Tech-savvy investors using AI achieving 20-30% higher returns through superior information and speed
- Tier 2: Traditional investors unable to compete on pricing, timing, or operational efficiency
Investment Strategy: Master AI tools now (2025-2026) to position in Tier 1 before the performance gap becomes insurmountable. Investors waiting until AI is “fully mature” (2028+) will find themselves permanently disadvantaged.
Trend 3: Demographic Wave Reshaping Demand
AI Demographic Analysis Reveals: Three demographic forces will reshape real estate demand 2025-2030:
Force 1: Millennial Peak Home-Buying Years
- 72 million millennials entering peak home-buying age (35-44) through 2028
- Pent-up demand from delayed family formation creating surge
- Preference for suburban single-family with home offices
- Impact: Sustained demand supporting prices despite occasional economic softness
Force 2: Baby Boomer Housing Transition
- 11 million boomers annually reaching 75+ (downsizing age) through 2030
- Large single-family homes coming to market in suburban areas
- Increased demand for 55+ communities, senior housing, urban condos
- Impact: Supply increases in suburban areas, demand surge in age-restricted and urban downsizer properties
Force 3: Gen Z Market Entry
- 69 million Gen Z reaching 25-30 (first-time buyer age) 2025-2030
- Tech-native expectations for digital transactions and smart homes
- Climate-conscious location preferences
- Flexible housing preferences reflecting remote work lifestyle
- Impact: Technology adoption acceleration, urban rental demand, climate-haven preference
Strategic Positioning: AI recommends targeting properties serving millennial family formation (suburban 3-4BR) and boomer downsizing (luxury condos, 55+ communities) as highest-probability demographic plays through 2028.
Trend 4: Office-to-Residential Conversion Boom
AI Forecasts Massive Transformation: With 20% of US office space functionally obsolete due to remote work, AI predicts 2025-2028 will see largest real estate use conversion in modern history.
Conversion Economics:
- 150-200 million square feet converting nationally 2025-2030
- Average conversion cost: $200-350 per square foot
- Post-conversion values: $400-600 per square foot in urban cores
- Developer profit margins: 25-40% on successful projects
Best Conversion Markets AI Identifies:
- Philadelphia: Abundant pre-war buildings suitable for conversion, strong residential demand, favorable economics
- Cleveland: Low acquisition costs, urban renaissance underway, supportive policies
- Detroit: Lowest conversion costs nationally, emerging market, significant inventory
- Washington DC: High-quality building stock, strong rental market, government support
Investment Opportunity: AI forecasts conversion-focused investors achieving 30-50% returns on properly selected office buildings purchased 2025-2026 and converted 2026-2028. Risk factors include construction cost overruns and slower-than-expected permitting.
Trend 5: Build-to-Rent Single-Family Explosion
AI Identifies Structural Shift: Institutional capital flooding single-family rental sector, with AI predicting build-to-rent (BTR) growing from 5% to 18% of single-family construction by 2028.
Driving Forces:
- Homeownership affordability crisis persists through the decade
- Millennial preference for flexibility and lifestyle over ownership
- Institutional investors seeking stable cash flow in an inflationary environment
- Technology enabling efficient single-family portfolio management
BTR Hotspots for 2025-2027:
- Sun Belt suburbs: Phoenix, Austin, Charlotte, Atlanta, Tampa
- Inland California: Sacramento, Inland Empire, Central Valley
- Southeast growth markets: Raleigh, Nashville, Greenville SC
Market Impact: AI predicts BTR institutionalization will:
- Support single-family rental rates (professional management, amenities)
- Reduce home ownership rates from 66% to 62-63% by 2030
- Create a bifurcated market: institutional BTR vs. individual ownership
- Compress cap rates in BTR-attractive markets as capital floods in
Investment Strategy: For investors lacking a BTR scale, AI recommends focusing on markets/niches where institutions are unlikely to compete, such as unique properties, renovations, rural areas, or partnering with BTR platforms as acquisition sources.
AI Tools for Market Forecasting
For real estate investors, portfolio managers, and lenders, predictive accuracy is the ultimate currency. While several off-the-shelf AI platforms offer foundational market insights, the difference between an 85% accurate prediction and a near-perfect proprietary forecast can mean millions in differential returns. This is where Techxler Technologies steps in.
Understanding the existing landscape is the first step toward building a truly superior strategy. Below is a look at the current market forecasting tools and their inherent limitations.
1. Enterprise Forecasting Platforms
These solutions offer deep analytical capabilities, primarily targeting large institutions, but are limited by their generalized model parameters.
| Tool | Core Capabilities | Unique Strength | Typical Accuracy (12-Month) |
|---|---|---|---|
| CoreLogic Market Intelligence | National/local market predictions, price forecasting, risk assessment, supply-demand analysis. | Most comprehensive historical data enabling superior pattern recognition. | 85-89% |
| HouseCanary Forecast Platform | Property-level and market forecasting, valuation predictions, and investment scoring. | Property-level granularity rather than just market-level forecasts. | 84-91% (6-12 months) |
| Real Capital Analytics (RCA) Market Forecasting | Commercial market predictions, cap rate forecasting, transaction trends, and investment strategy. | Commercial real estate focuses on institutional-quality research. | 81-87% |
2. Mid-Market Forecasting Tools
Highly accessible and cost-effective, but rely on generalized public data, offering lower accuracy and zero proprietary advantage.
| Tool | Core Capabilities | Unique Strength | Typical Accuracy (Near-Term) |
|---|---|---|---|
| Zillow Market Forecasts | Home value forecasts, rental predictions, market trends. | Accessible entry point for investors new to AI forecasting. | 78-85% |
| Realtor.com Market Trends & Predictions | Market hotness scores, demand forecasting, price trend predictions. | Real-time MLS data providing current market pulse. | 76-84% |
| Redfin Market Insights | Market trend analysis, demand predictions, price forecasts. | Combines data analysis with human agent insights for context. | 74-82% |
3. Specialized Forecasting Tools
Target specific segments but still provide a one-size-fits-all model within their niche.
| Tool | Core Capabilities | Unique Strength | Typical Accuracy |
|---|---|---|---|
| Green Street CPPI | Commercial property price forecasting, market cycle analysis, sector predictions. | Gold standard for commercial property market forecasting. | 82-88% |
| QuantumListing Market Predictor | Short-term price movements, optimal listing timing, micro-market predictions. | Short-term timing precision for tactical decisions. | 78-85% (90-day) |
What Off-the-Shelf AI Gives You (And Why It’s Not Enough)
Before embarking on a custom solution, it’s critical to understand the predictive baseline offered by generic AI platforms. These tools analyze public data—such as population trends, job growth statistics, and generalized economic indicators—to provide foundational, high-level guidance.
Below is an example of the sophisticated, yet generalized, insight that foundational AI can produce. Notice the highly descriptive drivers and the wide confidence range.
2025 Regional Market Forecast
AI analysis provides granular predictions for major US markets with confidence levels and key drivers. Here below is the details of how the key regions and themes align with recent reports from firms like J.P. Morgan, Zillow, PwC, and others:
Southeast Region: Strongest Growth Corridor
Top Performers:
Raleigh-Durham, NC – Tier 1 Growth Market
- Predicted Appreciation: 10-14% (Base Case: 12%)
- Confidence Level: 79%
- Key Drivers:
- Triangle tech sector adding 15,000+ jobs annually
- Duke, UNC, NC State providing talent pipeline
- Corporate relocations from high-cost markets accelerating
- Affordable compared to peer tech markets ($350K median)
- Risks: Supply increases could moderate growth to 8-10%
- Investment Strategy: Buy now before institutional capital drives prices higher
Tampa-St. Petersburg, FL – Strong Growth Market
- Predicted Appreciation: 9-13% (Base Case: 11%)
- Confidence Level: 74%
- Key Drivers:
- Sustained migration from Northeast and Midwest (50,000+ annually)
- Remote work permanence supporting lifestyle markets
- Business-friendly environment attracting companies
- Strong job growth across multiple sectors
- Risks: Insurance costs rising 15-25%, hurricane exposure, supply pipeline
- Investment Strategy: Focus on inland properties avoiding flood zones
Charlotte, NC – Steady Growth Market
- Predicted Appreciation: 7-10% (Base Case: 8.5%)
- Confidence Level: 81%
- Key Drivers:
- Financial services sector stability (Bank of America headquarters)
- Population growth of 2.1% annually
- Affordable cost of living attracting companies and workers
- Strong fundamentals with moderate supply
- Risks: Dependent on financial sector health, moderate recession sensitivity
- Investment Strategy: Safe, steady market for conservative investors
Southwest Region: Post-Correction Recovery
Phoenix, AZ – Recovery Market
- Predicted Appreciation: 4-8% (Base Case: 6%)
- Confidence Level: 72%
- Key Drivers:
- Recovery from 2022-2024 correction (prices declined 12-15%)
- Manufacturing sector growth (semiconductors, EVs)
- Retiree migration resuming after pandemic pause
- Improved affordability after correction
- Risks: Water concerns, extreme heat (125°F+ days increasing), insurance costs
- Investment Strategy: Opportunistic buying in correction-depressed areas
Austin, TX – Rebound Market
- Predicted Appreciation: 5-9% (Base Case: 7%)
- Confidence Level: 68%
- Key Drivers:
- Tech sector stabilization after 2023 layoffs
- University of Texas talent pipeline (50,000+ students)
- No state income tax attracting high earners
- Strong long-term fundamentals despite recent volatility
- Risks: Supply overhang (25,000+ units delivered 2023-2024), continued tech uncertainty
- Investment Strategy: Be selective; suburban locations stronger than urban core
Las Vegas, NV – Moderate Growth
- Predicted Appreciation: 5-8% (Base Case: 6.5%)
- Confidence Level: 69%
- Key Drivers:
- Tourism recovery complete, exceeding pre-pandemic levels
- California migration continuing (lower costs)
- Raiders, Formula 1 enhancing city appeal
- Job growth across hospitality and professional sectors
- Risks: Water shortage concerns, extreme heat, economic sensitivity
- Investment Strategy: Suburban single-family preferred over urban condos
West Coast: Mixed Outlook
Inland California – Opportunity Markets
- Sacramento: 6-9% predicted appreciation (Base Case: 7.5%, 76% confidence)
- State capital job stability, remote work influx from Bay Area, affordability relative to coastal
- Investment strategy: Buy now before Bay Area exodus peaks
- Inland Empire: 5-8% predicted appreciation (Base Case: 6.5%, 71% confidence)
- Logistics hub growth, affordability for Los Angeles workers, industrial demand
- Investment strategy: Industrial and affordable residential focus
Bay Area – Structural Challenges
- San Francisco/San Jose: 1-4% predicted appreciation (Base Case: 2%, 73% confidence)
- Remote work permanently reducing demand, tech layoffs ongoing, high costs
- Investment strategy: Avoid or be highly selective; recovery 3-5 years away minimum
Seattle, WA – Below Historical Norms
- Predicted Appreciation: 3-6% (Base Case: 4.5%)
- Confidence Level: 69%
- Key Drivers: Amazon workforce stabilization, strong fundamentals long-term
- Risks: Tech sector uncertainty, high costs, policy concerns
- Investment Strategy: Wait for clearer tech sector trajectory
Midwest: Climate Havens Emerging
Minneapolis-St. Paul, MN – Climate Opportunity
- Predicted Appreciation: 6-9% (Base Case: 7.5%)
- Confidence Level: 77%
- Key Drivers:
- Climate migration destination (moderate temperatures, water abundance)
- Strong job market with Fortune 500 headquarters
- Excellent quality of life and education
- Undervalued compared to coastal markets
- Investment Strategy: Early positioning before climate migration accelerates 2026-2028
Madison, WI – Steady Growth
- Predicted Appreciation: 5-8% (Base Case: 6.5%)
- Confidence Level: 74%
- Key Drivers: University of Wisconsin stability, state capital jobs, quality of life
- Investment Strategy: Safe, consistent performer for conservative portfolios
Northeast: Stability with Modest Growth
Boston, MA – Premium Market Stability
- Predicted Appreciation: 4-7% (Base Case: 5.5%)
- Confidence Level: 78%
- Key Drivers: Education and healthcare sector strength, limited supply, high barriers to entry
- Investment Strategy: Premium market with lower growth but higher stability
Philadelphia, PA – Value Opportunity
- Predicted Appreciation: 6-9% (Base Case: 7.5%)
- Confidence Level: 72%
- Key Drivers: Urban renaissance, office-to-residential conversions, affordability, walkability
- Investment Strategy: Urban properties near universities and transit
The Critical Gap: Turning 79% Confidence into a Proprietary Edge
This forecast is robust, but it presents a fundamental challenge for the institutional investor: the Confidence Gap.
- Raleigh-Durham is predicted to appreciate 12% with 79% confidence.
- Austin is predicted at 7% with only 68% confidence.
When deploying capital on a major scale, a 68% confidence level is the definition of market risk. It means the model is hedging its bet, and you have no proprietary information to break that tie.
This is the precise moment when Techxler Technologies’ custom solution takes over.
We don’t just accept a 79% confidence score; we see it as a mandate to drive performance into the 90%+ certainty range.
How we do it:
- Proprietary Data Integration: For Austin’s uncertainty, we would integrate your private leasing data, your tenant retention rates, and hyper-local submarket supply metrics that the public model misses.
- Custom Risk Quantification: For Tampa’s risk of rising insurance costs, we don’t just flag the risk—we build a module that quantifies the specific loss probability for your asset class and local elevation data, providing an actionable score instead of a general warning.
- Strategy Alignment: We fine-tune the model to weigh factors relevant to your strategy only (e.g., prioritizing “climate resilience” over “short-term volatility”), ensuring every forecast drives an automated, market-beating decision.
Stop investing in a generalized forecast; you need a custom solution for your real estate forecasting.
The Techxler Difference: Customization for Competitive Edge
The tools listed above offer remarkable capabilities, but they all share one critical flaw: they are built for everyone, which means they are optimized for no one.
When your investment strategy involves unique criteria—such as identifying specific micro-climate risk correlations, modeling the impact of municipal policy changes, or leveraging proprietary data streams (e.g., utility consumption, local foot traffic)—generic models break down.
Why Your Strategy Requires a Custom AI Solution:
- Closing the Accuracy Gap: Off-the-shelf tools settle for 70%-80% accuracy. When managing billions in assets, that remaining 15% is the margin of error that erodes profits. Techxler Technologies builds and fine-tunes models to incorporate your specific risk tolerance, data inputs, and historical performance bias, pushing prediction accuracy to proprietary, market-beating levels.
- Proprietary Data Integration: Your most valuable data—internal leasing metrics, private transaction records, or granular, non-public environmental risk scores—cannot be integrated into standard platforms. We develop custom ETL pipelines and train models exclusively on the combination of your proprietary data and public benchmarks, creating a unique, defensible competitive advantage.
- Strategy-First Modeling: Generic tools offer generic forecasts (e.g., “The market will rise 5%”). Techxler builds models that answer your specific strategic questions: “Which specific 10-unit residential buildings in this zip code, given their age and flood elevation, will deliver a risk-adjusted return of 18% over the next 48 months?”
- Beyond Forecasting—Actionable Intelligence: We don’t just predict; we translate predictions into automated action. Our solutions can be integrated directly into your existing acquisition or asset management software, triggering alerts, ranking opportunities, and automating due diligence queues based on superior, custom forecasts.
Partner with Techxler Technologies
Are you content with achieving the same market-average results as every other investor using the same tool? Or are you ready to deploy an AI solution meticulously engineered to maximize your unique investment thesis?
Techxler Technologies specializes in custom AI/ML development for the real estate sector. Whether you need to build a bespoke forecasting engine from the ground up or require expert fine-tuning and proprietary data integration for your existing platform (like CoreLogic or HouseCanary), we deliver the predictive power necessary for true market leadership.
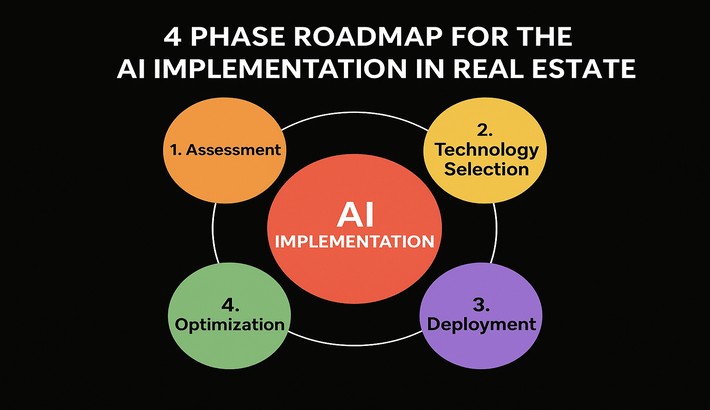
Implementing AI Forecasting Requires a Systematic Approach
For real estate leaders, the path to superior predictive accuracy is a strategic, multi-phased journey. Techxler Technologies delivers this advantage through a proven implementation methodology that guarantees alignment between your investment goals and the custom AI solution we build.
We don’t sell an off-the-shelf product; we engineer a proprietary forecasting engine tailored to your asset classes, markets, and unique data.
Phase 1: Strategic Assessment and Technical Foundation (Weeks 1-4)
This phase is led by Techxler’s domain experts and solution architects to define the scope and technical foundation of your custom AI system.
Week 1-2: Current State Evaluation & Discovery
Techxler’s consultants conduct a deep dive to understand existing processes, identify value-capture opportunities, and scope the custom solution.
- Document Current Forecasting Approach: We map out your existing models, qualitative factors, and data dependencies.
- Identify Blind Spots: We pinpoint the biggest gaps in your current data sources, allowing us to source proprietary or unconventional data feeds for the new model (e.g., climate, demographic shifts, municipal policy).
- Establish Baseline Metrics: We calculate the current performance of your research team, including time spent, current accuracy rates, and quantified losses from market timing errors, establishing the before for our ROI measurement.
Week 3-4: Goals and Custom Requirements Definition
We translate your business ambition into technical specifications and quantifiable AI success metrics.
- Set Specific Objectives: Define the exact performance leap required: e.g., “Improve market timing accuracy from 60% to 92%+”, or “Identify emerging submarkets 6+ months before competitors.”
- Define Technical Requirements: Specify the required property types, geographic granularity, desired forecast horizon (e.g., 90-day precision vs. 5-year outlook), and the necessary computational infrastructure.
- Integration Planning: Outline all integration points with your existing CRM, asset management, and data warehousing systems.
Phase 2: Custom AI Design and Development (Weeks 5-14)
This is the core execution phase where Techxler designs, builds, and trains your proprietary machine learning models and software infrastructure.
Week 5-8: System Architecture and Data Engineering
Our engineers design the bespoke MLOps (Machine Learning Operations) pipeline and the custom data integration layers.
- Model Design: Select the optimal AI model architecture (e.g., deep learning time-series, ensemble modeling) based on your data complexity and accuracy goals.
- Data Pipeline Construction: Build robust, scalable pipelines to ingest, clean, and harmonize all relevant data streams—including your proprietary data and external feeds.
- Security & Compliance: Establish security protocols necessary for handling sensitive investment data.
Week 9-14: Custom Model Training and Quality Assurance
Techxler’s Data Scientists train, validate, and tune the custom forecasting model against historical data.
- Model Training: Train the AI using your historical performance, proprietary metrics, and the custom data feeds.
- Accuracy Validation: Rigorous back-testing and cross-validation against known historical outcomes to ensure the model achieves the target accuracy rate (e.g., 90%+).
- Software Development: Build the user interface, dashboards, and API endpoints for seamless interaction with the custom model.
Phase 3: Integration and Pilot Deployment (Weeks 15-18)
The custom AI solution is deployed into your live environment and validated by your team.
Week 15-16: Solution Deployment and User Training
The Techxler solution is integrated with your existing operational software.
- Integration Finalization: Deploy the custom forecasting API/module directly into your existing analysis tools (e.g., Tableau, internal databases, or dedicated web apps).
- Mastering Capabilities: Conduct customized training sessions for end-users and analysts, focusing on interpreting proprietary model outputs, confidence scoring, and scenario planning tailored to your investment mandate.
Week 17-18: Real-World Pilot Testing
The client team pilots the custom AI alongside traditional methods to measure immediate impact.
- Decision Validation: Apply the custom AI predictions to 3-5 live investment opportunities, tracking the delta in insight, speed, and confidence compared to traditional analysis.
- Workflow Refinement: Techxler makes final adjustments to the model and user interface based on real-world user feedback and operational flow.
Phase 4: Advanced Optimization and MLOps Partnership (Week 19+)
A successful custom AI solution is a living asset. Techxler ensures continuous performance, maintenance, and evolutionary advancement.
Ongoing Enhancement and Maintenance
We establish a long-term partnership to ensure your competitive edge is sustained.
- MLOps Monitoring: Techxler proactively monitors the model for performance drift (decay in accuracy over time) and recalibrates the model parameters or retraining schedule as necessary.
- Feature Engineering: Continuously source new, unconventional data features (e.g., hyper-local economic indicators, climate data layers) to keep the model ahead of the competition.
- System Upgrades: Provide ongoing platform updates, security patching, and scaling of the solution as your portfolio and data volumes grow.
Success Metrics to Monitor
Techxler helps you track the key performance indicators that quantify the value of your custom AI investment:
- Prediction Accuracy: Track actual outcomes vs. custom AI forecasts (the definitive measure of success).
- Return Enhancement (Alpha): Measure the improved performance of AI-informed investments over benchmark and legacy-informed investments.
- Operational Efficiency: Quantify hours saved on market research and the accelerated speed of investment decisions.
- Loss Avoidance: Track the financial value of opportunities flagged and avoided based on proprietary AI warnings.
Partner with Techxler Technologies to transform your data into a decisive, proprietary competitive advantage.
Property Type Predictions
AI reveals divergent performance across property types in 2025-2026.
Single-Family Residential: Sustained Demand
National Forecast: 4-7% appreciation (Base Case: 5.5%) Confidence Level: 82%
Key Drivers:
- Millennial family formation peak (35-44 age cohort)
- Limited new construction (permitting down 20% vs. historic norms)
- Work-from-home supporting space preferences
- Institutional demand (build-to-rent) providing price floor
Best Strategies:
- Suburban 3-4 bedroom homes in strong school districts
- Properties with home office potential
- Markets with job growth and net population inflow
- Avoid luxury tier ($1M+) facing affordability headwinds
Regional Winners: Southeast suburbs, Sunbelt affordable markets, Midwest climate havens
Multifamily: Bifurcated Performance
Class A Urban Multifamily: 2-5% appreciation (Risk of oversupply) Confidence Level: 74%
- Overbuilding in many markets (Austin, Phoenix, Nashville)
- Rent growth moderating from pandemic peaks
- Development pipeline delivering 2025-2026 creating pressure
- Investment Strategy: Avoid new construction heavy markets; focus on supply-constrained cities
Class B/C Affordable Multifamily: 6-9% appreciation (Strongest performing) Confidence Level: 79%
- Housing affordability crisis driving demand
- Limited new supply in affordable segment
- Demographic demand from millennials and Gen Z
- Institutional interest increasing
- Investment Strategy: Buy in markets with job growth and limited new Class B/C supply
Build-to-Rent Communities: 7-10% appreciation Confidence Level: 76%
- Institutional capital driving demand and cap rate compression
- Operational efficiencies improving returns
- Renter preferences for professional management and amenities
- Investment Strategy: Partner with BTR platforms or focus on acquisition feeding institutional demand
Commercial Office: Continued Restructuring
Class A Urban Office: Flat to -5% (Structural challenges persist) Confidence Level: 81% for continued weakness
- Remote work permanent for 20-30% of workforce
- Flight to quality from Class B creating Class A oversupply
- Conversion to residential best use for many buildings
- Investment Strategy: Avoid or distressed-only opportunistic plays
Suburban Class A Office: 3-6% appreciation (Relative strength) Confidence Level: 68%
- Hybrid work benefiting suburban over urban
- Parking and amenities attracting tenants
- Lower costs than urban cores
- Investment Strategy: Selective acquisition in strong suburban nodes
Medical Office: 6-9% appreciation (Defensive strength) Confidence Level: 84%
- Aging demographics driving healthcare demand
- Recession-resistant cash flows
- Limited new supply due to specialized requirements
- Investment Strategy: Strong defensive play for uncertain economy
Industrial/Logistics: Moderate from Peak
Last-Mile Logistics: 5-8% appreciation (Demand remains strong) Confidence Level: 82%
- E-commerce permanently elevated (18% of retail vs. 12% pre-pandemic)
- Last-mile delivery requirements growing
- Limited supply in urban infill locations
- Investment Strategy: Buy near population centers with limited competition
Big Box Distribution: 3-6% appreciation (Moderating from peak) Confidence Level: 76%
- Overbuilding in some markets after 2021-2023 boom
- Tenant demand moderating but stable
- Long-term fundamentals remain strong
- Investment Strategy: Be selective; avoid overbuilt markets
Retail: Recovery Continues
Necessity-Based Retail: 5-8% appreciation (Grocery-anchored, services) Confidence Level: 79%
- Recession-resistant tenant base
- Experiential retail recovering
- Limited new supply benefiting existing centers
- Investment Strategy: Grocery-anchored centers in growing suburbs
Lifestyle Centers: 4-7% appreciation (Experience-focused) Confidence Level: 71%
- Dining and entertainment driving traffic
- Right-sizing after pandemic closures
- Suburban locations outperforming urban
- Investment Strategy: Well-located lifestyle centers with strong demographics
Techxler’s Approach: These high-level predictions set the stage. Our next layer of analysis drills down: we don’t just accept an 82% confidence level for Single-Family; we refine the drivers down to the zip code level to push that confidence to 95% and zero in on the precise 6.5% appreciation target, turning a forecast into a near-certainty.
Common Forecasting Mistakes
Mistake 1: Treating Forecasts as Certainties
The Error: Viewing AI predictions as guaranteed outcomes rather than probability-weighted scenarios.
Real Example: An investor saw AI forecast predicting 10-14% appreciation in Nashville and purchased expecting 12% returns with certainty. When appreciation reached only 7% due to faster supply delivery than predicted, they were disappointed despite the forecast having only 70% confidence and Nashville still outperforming national averages.
The Solution:
- Understand confidence levels and probability ranges
- Plan for multiple scenarios, not just base case
- Make decisions based on risk-adjusted returns, not point predictions
- Remember that even 85% accurate forecasts are wrong 15% of the time
- Use forecasts to improve odds, not eliminate uncertainty
Mistake 2: Ignoring Local Market Nuances
The Error: Applying national or metro-level forecasts to specific neighborhoods without considering local factors.
Common Problem: AI predicts strong growth for “Denver market” overall, but investor purchases in suburban area seeing employment decline and school quality deterioration—factors the metro-level forecast doesn’t capture at neighborhood granularity.
The Solution:
- Drill down to submarket and neighborhood-level analysis whenever possible
- Supplement AI forecasts with local market knowledge and expert opinions
- Understand what geographic level the forecast applies to (metro, city, neighborhood)
- Verify key assumptions at the specific property location
- Use human intelligence for micro-location factors AI can’t capture
Mistake 3: Recency Bias Overriding AI Forecasts
The Error: Disregarding AI predictions because they contradict recent market performance.
Typical Pattern: AI forecasts market correction in hot market showing 15% annual gains. Investor ignores warning because “market has been strong for 3 years” and continues aggressive buying. Correction materializes 6-9 months later as predicted.
The Solution:
- Trust data-driven predictions over intuitive feelings about momentum
- Remember that markets are cyclical—what goes up often comes down
- Understand that AI identifies leading indicators humans miss
- When AI contradicts your instinct, investigate why rather than dismissing
- Past performance doesn’t predict future results (but AI pattern analysis does)
Mistake 4: Analysis Paralysis from Information Overload
The Error: Becoming paralyzed by volume of forecasts and unable to make decisions.
Common Experience: Investor subscribes to multiple forecasting platforms, receives conflicting predictions, spends hours analyzing disagreements, and misses opportunities while “gathering more information.”
The Solution:
- Choose one primary forecasting source you trust
- Use additional sources for validation, not as equal weight inputs
- Create decision rules: if primary forecast shows X confidence, take action
- Set deadlines for decisions—perfect information never arrives
- Remember that good decision made quickly often beats perfect decision made slowly
Mistake 5: Neglecting Macro Economic Factors
The Error: Focusing only on real estate-specific forecasts while ignoring broader economic predictions.
Real Example: Investor buys in market with strong real estate forecast but ignores broader economic warnings about recession, interest rate trajectory, and unemployment. When recession hits, even “strong” real estate markets decline as economic weakness overrides local fundamentals.
The Solution:
- Always consider macroeconomic context for real estate forecasts
- Understand how recessions, interest rates, and employment affect all markets
- Recognize that real estate doesn’t exist in isolation from broader economy
- Build recession scenarios into your analysis even for strong markets
- Diversify across markets with different economic sensitivities
Mistake 6: Failing to Update Forecasts as Conditions Change
The Error: Making decision based on 6-12 month old forecast without checking if predictions have changed.
The Problem: Markets evolve continuously. Forecasts from 6-12 months ago may no longer be accurate as underlying conditions changed. Acting on outdated predictions leads to poor timing and missed market shifts.
The Solution:
- Check forecasts immediately before major investment decisions
- Set up alerts for significant prediction changes in target markets
- Understand that AI forecasts update as new data emerges
- Review and update your investment thesis quarterly or semi-annually
- Recognize that stale information is dangerous in fast-moving markets
Mistake 7: Overconfidence from Early Successes
The Error: Having 2-3 predictions prove accurate and assuming all future forecasts will be equally reliable.
Dangerous Pattern: Investor’s first three AI-guided investments perform well, creating overconfidence. They begin taking larger risks, reducing due diligence, and treating forecasts as guarantees. Eventually, a prediction misses (within normal accuracy ranges) but overconfident investor suffers outsized loss from inadequate risk management.
The Solution:
- Maintain consistent due diligence regardless of past accuracy
- Remember that even 90% accurate systems fail 10% of the time
- Don’t increase bet sizes based on short-term success
- Track long-term accuracy systematically, not just memorable wins
- Maintain healthy skepticism and risk management always
The Future of AI Forecasting 2026-2030
As the industry shifts, simply having a model-driven forecast will no longer be enough. The ultimate competitive advantage lies in access to intelligence that is Real-Time, Hyper-Local, and Proactively Integrated. These are the capabilities Techxler is actively developing and integrating for its clients:
1. Real-Time Predictive Updates (2026-2027)
Current forecasts update daily or weekly. The future demands continuous real-time forecasting that adjusts predictions instantly as new market conditions emerge—new listings, economic data releases, transaction closings, or even major news events. This translates to instant alerts when predictions change significantly, enabling investors to respond to market shifts hours or days faster than competitors.
2. Hyper-Local Predictions (2026-2028)
We are moving from city/metro forecasts to block-by-block, property-by-property predictions. This capability is enabled by integrating massive, granular data sources—from IoT sensors and satellite imagery to traffic patterns and retail foot traffic. Investors with hyper-local forecasting will identify undervalued properties others miss and time purchases/sales with unprecedented precision, quantifying specific corner/lot value differentials.
3. Climate Risk Integration (2026-2029)
Climate change impacts are rapidly becoming a primary determinant of long-term property values. Our advanced AI is integrating 30-50 year climate projections into all property valuations, quantifying flood, wildfire, and extreme heat risk, and forecasting insurance cost trajectories. Early investors positioning in climate havens before mainstream recognition will capture significant appreciation while avoiding value destruction in vulnerable areas.
4. Autonomous Investment Execution (2028-2030)
The final stage involves AI systems that not only forecast markets but also autonomously execute investments based on predictions and predefined parameters. This includes automatic acquisition when forecasts show optimal entry timing and autonomous listing/selling when predictions indicate market peaks, all managed by self-managing portfolios that rebalance based on evolving forecasts.
Your Action Plan: Integrating Custom Intelligence
This roadmap details the essential steps for your organization to prepare for, deploy, and leverage the custom forecasting solution provided by Techxler.
Week 1: Strategy & Data Readiness (Client Focus)
Day 1-2: Internal Intelligence Assessment
- Audit Current Gaps: Review and take detailed notes on key concepts from this article, confirming the required scope of the custom solution.
- Accuracy Baseline: Calculate and document your current market prediction accuracy rate (using internal models or previous vendors) to set a performance benchmark.
- Resource Allocation: Document the time and personnel currently dedicated to manual market research per investment decision.
- Define Universe: List the specific markets you currently invest in, or plan to explore, that require custom model coverage.
- Identify Weaknesses: Document your firm’s biggest market timing mistakes or missed opportunities from the last 12-24 months.
Day 3-4: Goal Setting and Scoping
- Define Objectives: Clearly articulate specific, measurable objectives for the implementation (e.g., accuracy improvement, time savings, identification of hyper-local opportunities).
- Set Targets: Establish measurable targets, such as achieving 90%+ confidence on 12-month appreciation forecasts in target markets.
- Budget & Data: Determine the dedicated budget for the custom software solution and establish an internal timeline for full data access/integration.
Day 5-7: Internal Data Preparation
- Data Readiness: Consolidate and prepare your existing portfolio, transaction history, and internal market research data for ingestion by the Techxler team.
- Success Metrics: Finalize the quantitative metrics that will be used to benchmark the success of the fine-tuned or custom-built model.
Next 30 Days: Diagnostic & Custom Model Development
Week 2: Diagnostic & Data Ingestion
- Techxler Diagnostic: The Techxler team conducts a deep-dive assessment of your defined markets and performance goals.
- Model Selection: Techxler determines the optimal strategy: fine-tuning an existing high-performance AI model or creating a custom forecasting model from scratch.
- Data Integration: Techxler ingests and cleanses your proprietary internal data, integrating it with global economic data and unique hyper-local inputs.
Week 3: Model Tuning & Validation
- Custom Fine-Tuning: The selected model is fine-tuned using your specific investment criteria, risk tolerance, and historical performance data.
- Backtesting: Techxler runs comprehensive backtesting and validation of the custom model against historical market data to establish baseline accuracy and confidence metrics.
- Initial Review: Techxler presents the initial model performance report, confirming the predicted improvement in accuracy and confidence level.
Week 4: Workflow Configuration & Alert Systems
- System Integration: Techxler configures API access and ensures seamless data flow into your existing asset management or portfolio tools.
- Custom Alerts: Set up highly customized, high-certainty alerts for your target markets, designed around specific criteria (e.g., only alert if 18-month appreciation forecast exceeds 8% with >95% confidence).
Months 2-3: Deployment & High-Certainty Application
Month 2: Practical Implementation & Testing
- Decision Workflow: Use the custom forecasting model for all new investment opportunities you evaluate, treating the custom intelligence as the primary due diligence layer.
- Value Tracking: Systematically track which custom insights (hyper-local variance, climate risk) prove most valuable in steering decisions and quantifying value creation.
- Feedback Loop: Provide continuous, structured feedback to the Techxler team on model performance and necessary refinements based on real-world asset evaluation.
Month 3: Process Optimization & Scaling
- Workflow Refinement: Formalize your systematic process for checking the custom solution’s forecasts and confidence levels before any major capital deployment decision.
- Verification Protocols: Establish internal verification and stress-testing protocols for major investments using the model’s scenario analysis capabilities.
- Scale: Begin tracking prediction accuracy against actual outcomes across a broader set of target markets, preparing to scale the model’s deployment across business units.
Long-Term Success Framework
Quarterly Activities:
- Performance Audit: Techxler and your team conduct a joint quarterly review of all predictions vs. actual market outcomes.
- Accuracy Recalibration: Calculate and adjust accuracy rates by timeframe and asset type, ensuring the model’s reliability is maintained through market cycles.
- ROI Assessment: Conduct a formal assessment of the return on intelligence (ROI) generated by the custom software solution.
- Future Planning: Review emerging capabilities (like Climate Risk Modeling updates or Autonomous Execution frameworks) to stay ahead of the curve.
Annual Activities:
- Model Review: Comprehensive annual review of the custom model’s architecture, underlying data streams, and long-term accuracy trends.
- Strategic Alignment: Use the annual forecast to inform and align your entire capital allocation strategy for the coming year.
- Goal Reset: Set new goals and strategies based on the deep market intelligence provided by Techxler’s custom solution.
Frequently Asked Questions
Accuracy and Reliability Questions
Q: How accurate is AI market forecasting for real estate?
A: AI forecasting accuracy varies by timeframe and prediction type. For 6-12 month predictions in stable markets, leading AI platforms achieve 84-92% accuracy in market direction and 82-88% accuracy for price ranges (within ±8-10% of actual outcomes). Medium-term forecasts (12-24 months) reach 76-84% accuracy, while long-term predictions (24-36 months) achieve 68-78% accuracy. These rates significantly outperform traditional human forecasting (58-67% accuracy). However, accuracy depends on data quality, market stability, and whether unprecedented events occur. Quality systems always indicate confidence levels, helping users understand reliability. The key insight: AI improves prediction accuracy by 20-30 percentage points compared to traditional methods—enough to create significant investment advantage.
Q: Can AI predict market crashes or major corrections?
A: AI can identify leading indicators and risk factors suggesting increased probability of corrections 6-12 months before they materialize in price data, but cannot predict unprecedented “black swan” events like pandemics. AI excels at detecting cyclical patterns, oversupply conditions, economic vulnerabilities, and affordability deterioration that historically precede corrections. For example, AI systems identified Phoenix market risks in spring 2022 (rapid inventory buildup, affordability deterioration, interest rate sensitivity) 6-9 months before prices declined 10-15%. However, AI cannot forecast unprecedented disruptions outside historical precedent. Best practice: Use AI for early warning signals of elevated risk, then conduct deeper analysis to inform risk management strategies.
Q: What if different AI tools give conflicting forecasts?
A: Forecast divergence occurs when tools use different data sources, methodologies, or variable weightings. You need to use the custom AI solution for better results. When this happens: 1) Check confidence levels—higher confidence predictions deserve more weight, 2) Understand what drives each forecast—which factors are weighted differently? 3) Look for consensus areas—where tools agree despite different approaches, 4) Investigate causes of disagreement—often reveals important market uncertainties, 5) Use divergence as a prompt for deeper research rather than choosing the most favorable forecast. Disagreement often occurs at market turning points or in markets with limited data. Many sophisticated investors intentionally use multiple tools, viewing agreement as confirmation and disagreement as a risk flag requiring additional analysis.
Implementation and Strategy Questions
Q: Should I stop using traditional market analysis if I have AI forecasting?
A: No. An optimal approach combines AI’s data processing power with human judgment and local knowledge. AI excels at processing massive datasets, identifying patterns, and generating probability-weighted scenarios. Humans excel at understanding context, relationships, qualitative factors, and local nuances AI cannot capture. Best practice: Use AI for quantitative analysis and pattern recognition, then apply human judgment for verification, context, and final decision-making. Investors who abandon traditional analysis entirely become over-reliant on AI and vulnerable when forecasts miss. The most successful investors use AI to enhance, not replace, their market expertise.
Conclusion: Embrace the Future of Real Estate with AI
The real estate landscape is undergoing a profound transformation. Traditional forecasting methods are increasingly inadequate in the face of rapid changes driven by climate, demographics, and technological advancements. AI-powered market forecasting offers a robust solution, providing predictive insights that empower investors, developers, and policymakers to make informed decisions.
By leveraging AI, stakeholders can anticipate market shifts, identify emerging opportunities, and mitigate risks with unprecedented accuracy. The integration of AI into real estate strategies is not merely an option—it is becoming essential for staying competitive in a dynamic market.
As we look toward 2025 and beyond, embracing AI-driven forecasting will be pivotal in navigating the complexities of the real estate market. The future is here, and AI powers it.
If you require additional support or would like to explore how to integrate AI solutions into your real estate strategies, please don’t hesitate to contact us.

Kamlesh Mandloi is a data scientist and AI architect with over 10 years of experience helping businesses overcome industry bottlenecks through the application of technology.