AI in Real Estate Portfolio Management: Diversification & Risk Prediction
You buy assets in different cities, different asset classes, maybe even risk buckets — and you feel it’s diversified. But that feeling is lying to you.
Because diversification isn’t about owning “different things, in different locations.” It’s about owning things that won’t fail together, even in tough times.
The Illusion of Simple Diversification (The Spreadsheet Trap)
You might think you’re diversified because you own properties in Miami, Austin, and Denver. But if those markets depend on the same economic engine—like tech hiring—they can all drop together. What looks diversified on a spreadsheet is often highly correlated in real life.
Humans can only weigh a few variables at once (5–8 at best). But real estate risk is shaped by 200+ shifting factors—interest-rate sensitivity, climate exposure, tenant behavior, local policy changes, infrastructure trends, and more.
Result: Your “diversified portfolio” might actually be one big concentrated bet and you only discover it when the market turns.
We have seen traditional strategies for managing real estate portfolios fail exactly when we need them most — and history has already proven it.
2008 wiped out “safe” markets overnight. COVID turned commercial portfolios upside down in weeks. How Many Portfolios Actually Hold Up in a Crisis? Survival rates are shocking, a mere 12%-23%.
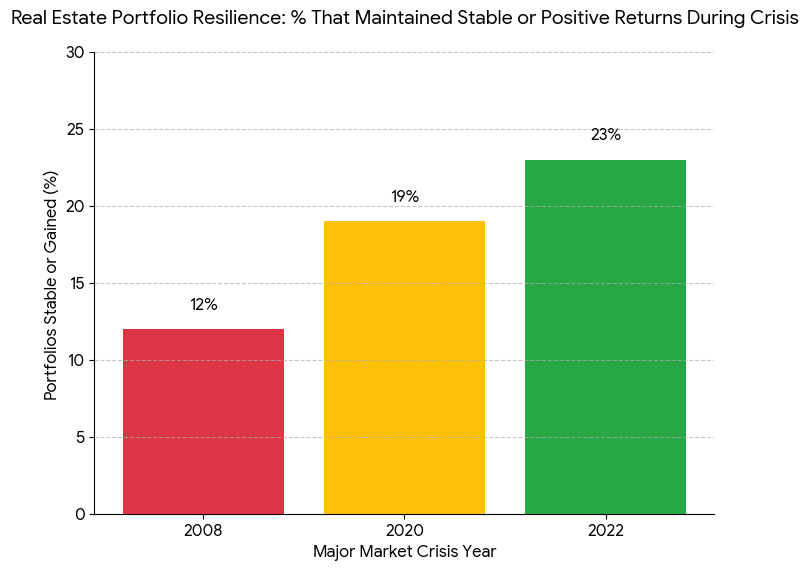
Source: Insight from MSCI’s “Global Real Estate Resilience Index
- 2008 Global Financial Crisis: 12%Only niche industrial + logistics + certain Sunbelt MF held up
- 2020 COVID Shock:19%Strong performers: industrial, data centers, workforce housing
- 2022 Interest Rate Spike: 23% Markets with low debt exposure + stable rent growth survived
Insights: This data shows that diversification by geography alone is a myth.
And today? Interest rates swing like a drunk pendulum, inflation signals contradict each other, and historical models are about as reliable as a map from 1990.
But there is a solution:
While most brokers and investors are still debating whether AI is “overhyped,” a tiny group of funds and institutional players are already using machine learning to:
- spot market corrections months before they hit,
- uncover correlations humans would never catch,
- stress-test portfolios across scenarios we haven’t even lived through yet.
- Identifies Hidden Risks Before Humans Notice
- Predicts Cash Flow More Accurately
- Shows Which Assets Help (or Hurt) Diversification
- Runs Instant “What-If” Simulations
- Recommends Rebalancing Moves
- Automates Monitoring
They’re not luckier. They’re not smarter. They’re just using Technology (AI), which turns real estate portfolio management from reactive to proactive — helping them spot risks early, forecast accurately, diversify intelligently, and make decisions with confidence.
The Real Risks with the Traditional Strategies
Risk 1: Valuation & Pricing Uncertainty: Right now, nobody really knows what properties are worth — not sellers, not buyers, not even seasoned fund managers.
Why? Because the market keeps shifting:
- Interest rates jump with no warning
- Inflation won’t settle
- Global events shake confidence
- Deals take longer, data gets stale faster
Traditional valuation tools like comps, cap rates, and NOI models were built for calm, predictable markets. Today’s market is anything but calm — so those models fall apart.
This is why buyers and sellers can’t agree on pricing anymore. The issue isn’t “greedy sellers” or “cheap buyers.” The price-discovery system itself is broken.
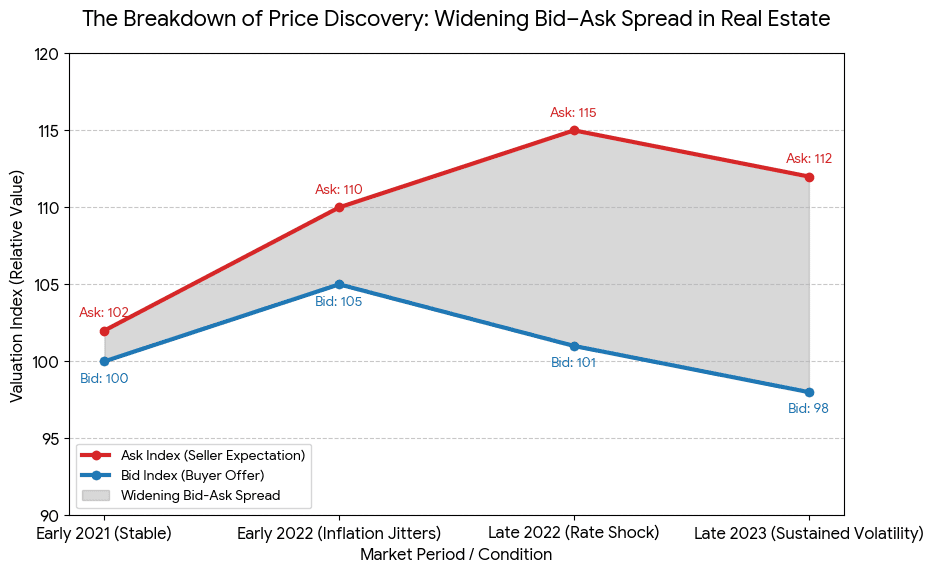
The Bid–Ask Spread Is Blowing Up:
- Early 2021 (Stable): Sellers at 102, buyers at 100 → Spread: 2
- Early 2022 (Inflation Jitters): Sellers 110, buyers 105 → Spread: 5
- Late 2022 (Rate Shock): Sellers 115, buyers 101 → Spread: 14
- Late 2023 (Volatility Continues): Sellers 112, buyers 98 → Spread: 14
The gray area in the chart— the Bid-Ask Spread — explodes from 2 to 14. That’s a 7x jump in pricing uncertainty, from 2021 -2023.
Why Fund Managers Hate This Part? Because when you can’t trust valuations.
- NAV becomes guesswork
- LPs lose confidence
- Redemption requests shoot up
- Raising new capital becomes painful
And the worst part? Cap rates are compressing. Income doesn’t support the valuations. Financing risk is rising. Loan quotes can change overnight.
Put those together, and a deal that looked “amazing” in week one can look toxic by the time you reach closing.
Risk 2: Data Fragmentation & Decision Velocity: Let’s be honest — most real estate teams don’t have a data problem. They have a data chaos problem.
Your market data is in one system.
Your financials in another.
Your property ops in a third.
Your analysts? Stuck stitching spreadsheets together like medieval monks rewriting the Bible by hand.
The Real Problem: Humans simply can’t process the volume, speed, and complexity of today’s data in time to make competitive decisions.
Meanwhile, the funds are using automated data pipelines and AI engines?
They underwrite deals in hours.
Legacy teams take weeks.
And here’s the part nobody wants to say out loud:
In competitive markets, the investor who analyzes fastest isn’t just “more efficient” — they win the deal.
Data fragmentation also inflates costs, slows reporting, and turns regulatory compliance into a monthly panic attack.
Risk 3: Correlation Blindness in Diversification
Most investors think they’re diversified because they own properties in different cities, different asset classes, and different risk profiles. But here’s the truth: If your assets fall together during a crisis, you were never diversified.
What “Correlation” Really Means. Correlation tells you how two assets move in relation to each other.
- +1 → They move the same way (bad for diversification)
- 0 → No relationship
- –1 → They move in opposite directions (best diversification)
The goal is simple: Own assets that don’t move the same way at the same time.
The Problem Nobody Talks About: Your portfolio looks diversified in normal markets.
But in a crisis — rates go up, credit tightens, demand drops — correlations spike. Cities that looked independent? Suddenly, they crash together.
Example: New York ≠ Miami in normal times. But hit both with rising rates or recession pressures, and their downside behavior becomes almost identical.
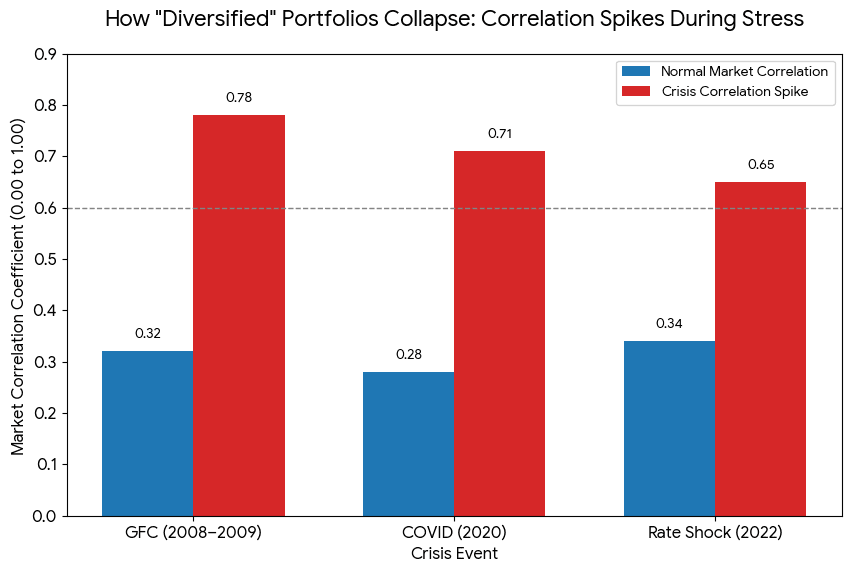
What the Data Shows
- Normal years (2017–2019): Correlation stayed low (0.28–0.34).
→ Everything looks safe and diversified. - Crisis years (2008–2009): Correlation jumped to 0.78.
→ Nearly 8 out of 10 markets fell together.
Insights: Your traditional diversification works when you don’t need it —and collapses the moment you do.
The Real Issue Behind the Failure: Most managers rely on historical correlations, but correlations can flip overnight when macro conditions change. That’s how hidden concentration risk creeps into your portfolio.
What Happens When Stress Hits: Assets that “shouldn’t move together” suddenly do. Your risk balloons. Your portfolio stops being diversified — despite what your pie charts promised.
What You Actually Need: Instead of relying on past correlations, use forward-looking tools:
- Stress tests
- Scenario simulations
- Recession modeling
- Predictive risk tools
These don’t tell you what happened last year — they show you where your biggest losses could come from next. Traditional models can’t do that. AI can.
You Need to Shift Your Strategies from Protection to Prediction
Here’s the mindset shift nobody tells you about: Protection is reactive. It kicks in after the damage starts.
Prediction is proactive. It lets you move before everyone else even realizes something’s wrong. And that’s the entire game. AI isn’t some magical shield that stops risk. It’s a radar. It spots volatility forming months before it hits your portfolio, that is enough time to take actions.
While traditional models are busy explaining what already happened, AI is busy showing you what’s about to happen months before.
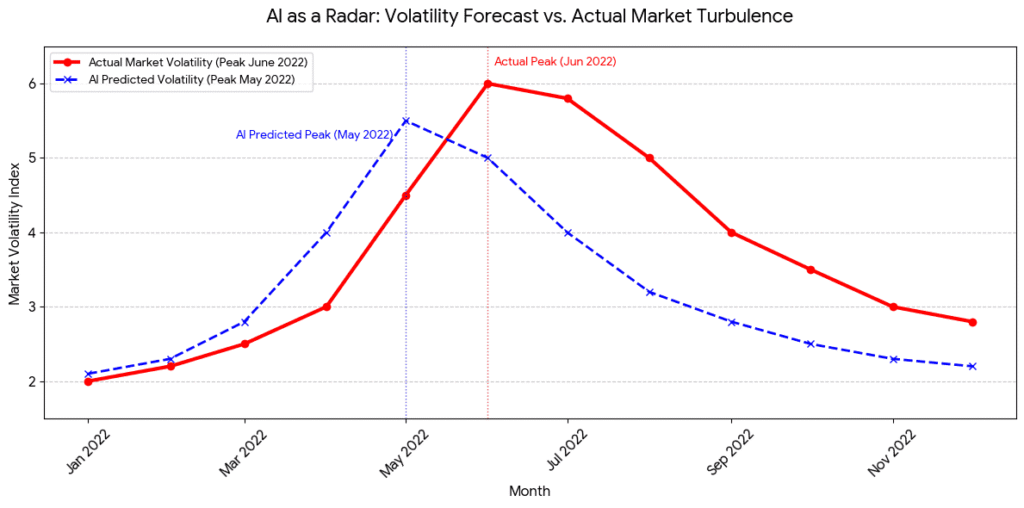
AI as a Radar: Volatility Forecast vs. Actual Market Turbulence: This visual reinforces the message that prediction is early, and protection is late.
- Actual Market Volatility: Red Solid Line: June 2022
- AI Predicted Volatility: Blue Dashed Line: May 2022
Insights: AI is predicting the volatility one month early, to be proactive.
How AI Works in Portfolio Management?
Let’s skip the buzzwords and get straight to what AI actually does for your portfolio.
Multi-Market Predictive Modeling
AI isn’t just crunching numbers — it’s spotting the future while everyone else is still dragging last quarter’s reports into Excel. It tracks thousands of micro-signals you’d never have time to check: leasing velocity, rate shifts, search demand, supply pipelines, even subtle sentiment changes across markets.
And from that sea of noise, it alerts you before things break (or boom):
- Price swings long before they appear in comps or broker chatter.
- Absorption rate drops months before tenants start disappearing.
- Yield compression in markets that still look “perfectly fine.”
- Market turning points analysts only recognize after the wave has already hit.
Smart Diversification
Most investors diversify based on gut feeling. AI diversifies on cold, ruthless math.
While humans spread capital across cities or asset classes because it “feels balanced,” AI actually runs millions of correlation checks in the background — across micro-markets, sub-asset types, tenant behavior patterns, supply pipelines, and dozens of macro signals. It involves 5 steps :
Step 1: Data Gathering and Feature Engineering:
AI starts by collecting every piece of information that can influence a property’s performance. Think of it as building a full 360° picture of your real estate assets.
1. Property-Level Data
Things directly tied to the property itself:
- Price history
- Rental income
- Vacancy rates
- Building age, size, and amenities
2. Market & Economic Data
Bigger forces that affect property value:
- Interest rates
- Job growth
- Local economic activity
- New infrastructure or development plans
3. Alternative Data (The hidden signals)
The data investors usually never see:
- Satellite images showing construction or neighborhood changes
- Social media sentiment
- Mobile-tracking data showing foot traffic trends
How AI Turns Raw Data Into Insights. After collecting all this, AI transforms it into meaningful “features” — these are smart indicators that reveal risk or opportunity.
Examples:
- Neighborhood Gentrification Score → detects early signs of improvement
- Property Liquidity Index → shows how quickly a property could sell
Rate-Adjusted Affordability Index → combines interest rates + home prices to predict buying pressure
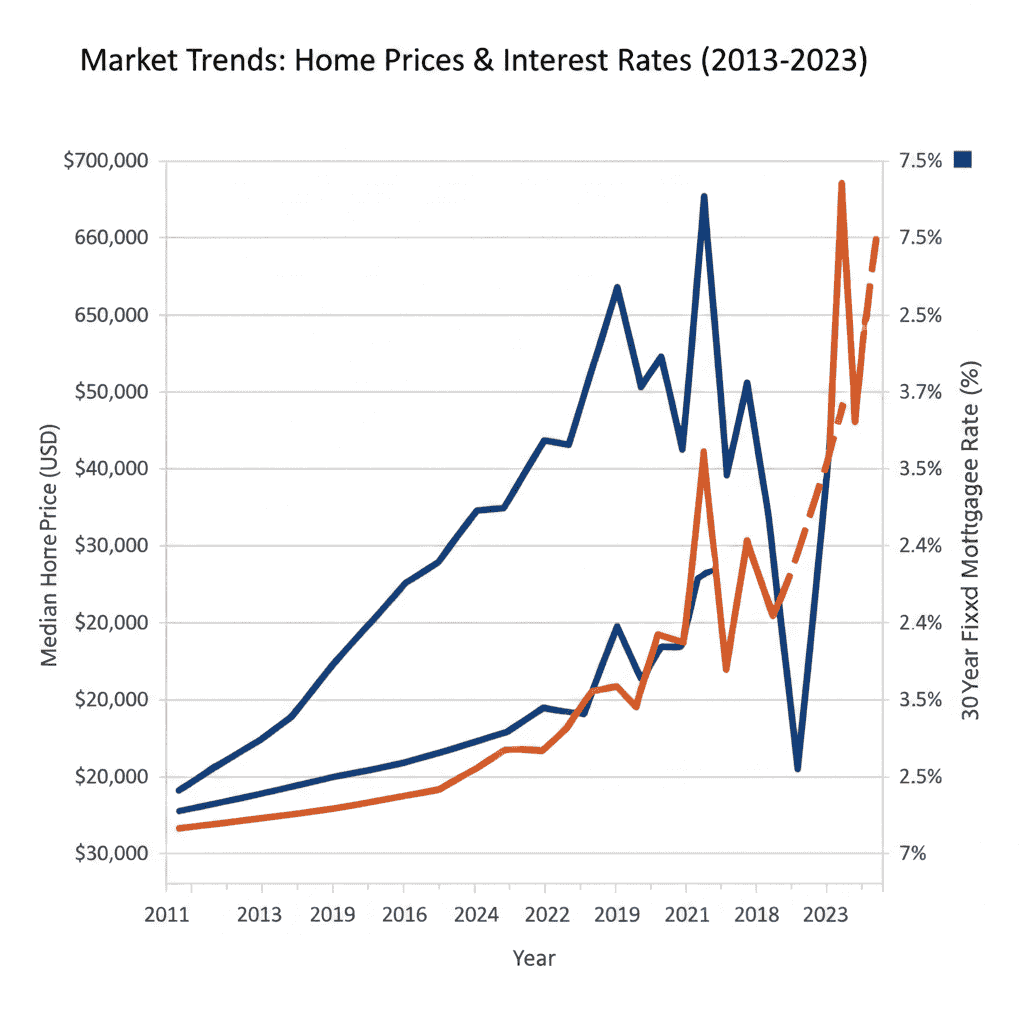
Median Home Price (USD): Shows how property values changed over time.
30-Year Mortgage Rate (%): Shows how borrowing costs moved during the same period.
Insight: AI learns the relationship between interest rates and home prices — how affordability changes, how demand reacts, and how quickly markets shift. These patterns become powerful predictors in your portfolio model.”Rate-Adjusted Affordability Index.
Step 2: Market Clustering — Finding Hidden Gems
AI doesn’t look at markets the way humans do. We look at cities, asset classes, and headlines. AI looks at patterns, behaviors, and relationships across thousands of data points.
Here’s what that means in practice:
AI Groups Markets by How They Actually Behave: Using clustering algorithms, AI sorts markets into color-coded groups based on things like:
- Rental trends
- Volatility
- Demand patterns
- Growth momentum
Two markets might look similar on a map, but the AI may see that they move completely differently.
It Finds Micro-Markets Humans Never Notice: Brokers talk about markets months after trends begin. AI spots those shifts early by scanning millions of data relationships. That’s how it uncovers hidden pockets like:
- “Emerging tech-adjacent suburbs”
- “Logistics-driven micro-cities”
- “Specialty storage clusters”
These often outperform before anyone realizes they exist.
It Shows What Really Diversifies You: Buying “different types of properties” isn’t diversification. Buying assets that don’t crash together is. Clustering reveals:
- which markets move together (bad for diversification)
- which markets stay independent (great for risk protection)
This is how AI finds true low-correlation safe havens.
It Surfaces High-Return, Low-Risk Groups: AI compares yield, vacancy patterns, growth speed, and risk metrics. Then it highlights clusters where the math literally says: “Better upside, lower downside — invest here.” These are opportunities spreadsheets usually miss.
It Detects Market Shifts Before Humans Blink: When one asset inside a cluster changes direction, AI sees it instantly. You get early warnings about:
- Pricing peaks
- Demand slowdowns
- Yield compression
- Upcoming volatility
This gives you reaction time that traditional managers never have.
Builds Portfolios Without Human Bias. People diversify on vibes. AI diversifies on data. Clustering removes the guesswork and builds portfolios that are balanced, risk-adjusted, and built to stay calm when the market goes loud. The result: Balanced, calm portfolios designed to survive noise, crashes, and surprises.
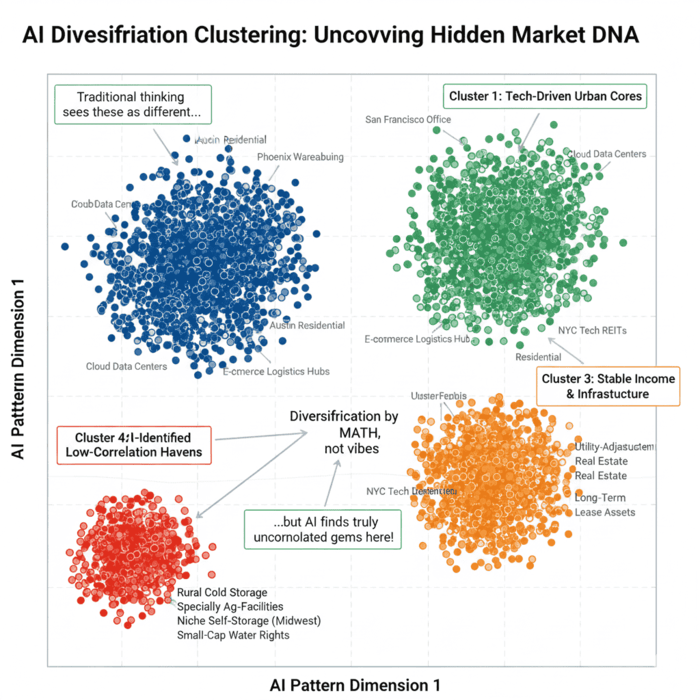
Understanding the Chart
- Each color group = markets that behave alike. They rise and fall together, regardless of location or asset class.
- Dots close together = NOT good for diversification. They respond to the same economic conditions.
- Small, isolated clusters = true hidden gems. These low-correlation markets are your strongest protection in downturns.
Example: Rural Cold Storage showing up far away from the main clusters means it moves independently — a perfect diversification asset.
Step 3: Predictive Modeling for Risk & Return
AI doesn’t guess — it runs thousands of simulations to see how every property or cluster might perform in different economic worlds.
Return Forecasting: Models like Deep Learning and Random Forests crunch insane amounts of data to predict growth, cash flow, and long-term upside with way more accuracy than human analysts.
Risk Assessment: AI stress-tests each asset against shocks — recessions, rate hikes, employer exits, even regional disasters — and highlights which properties are built for chaos… and which ones will crack first.
Step 4: Building the Correlation Matrix
This is where most investors get diversification completely wrong. Traditional investing looks backward — using 3–5 years of historical correlation data.
But history doesn’t help you when the market suddenly flips… when rates jump or when demand changes overnight.
AI does the opposite. It builds a forward-looking correlation matrix, predicting how different markets will move in future scenarios — not past ones.
Instead of asking: “Did these assets move together before?”
AI asks: “Will they move together when the next shock hits?”
That’s the whole game. And here’s why it matters:
- AI finds pairs of markets that don’t move together
- Some markets even show negative correlation — the holy grail of diversification
- When one cluster drops, another stays stable or rises
- Your overall portfolio remains steady instead of collapsing
Result? AI builds portfolios that are safer, smarter, and more profitable — with the same amount of capital, but far less risk. This is diversification powered by math, not guesses.

What this shows:
- Correlations are lower, more accurate, and predictively aligned with future scenarios.
- AI finds true negative correlations (the gold of diversification)
- Cluster 4 (Low-Correlation Havens) becomes the foundation of risk protection
Step 5: Optimization using the Efficient Frontier
AI uses the predicted returns, risks, and the dynamic correlation matrix to solve a complex Portfolio Optimization problem, resulting in the Efficient Frontier.
Customization: The AI allows the investor to select a point on the frontier that matches their risk tolerance (e.g., the minimum variance portfolio for the most risk-averse, or a higher-risk/higher-return portfolio).
The Efficient Frontier: This is a curve representing the set of optimal portfolios that offer the highest expected return for a defined level of risk, or the lowest risk for a given expected return.
AI’s Role: AI uses algorithms like Quadratic Programming or Reinforcement Learning to quickly search through billions of possible asset combinations to pinpoint portfolios along this frontier.
Customization: The AI allows the investor to select a point on the frontier that matches their risk tolerance (e.g., the minimum variance portfolio for the most risk-averse, or a higher-risk/higher-return portfolio).
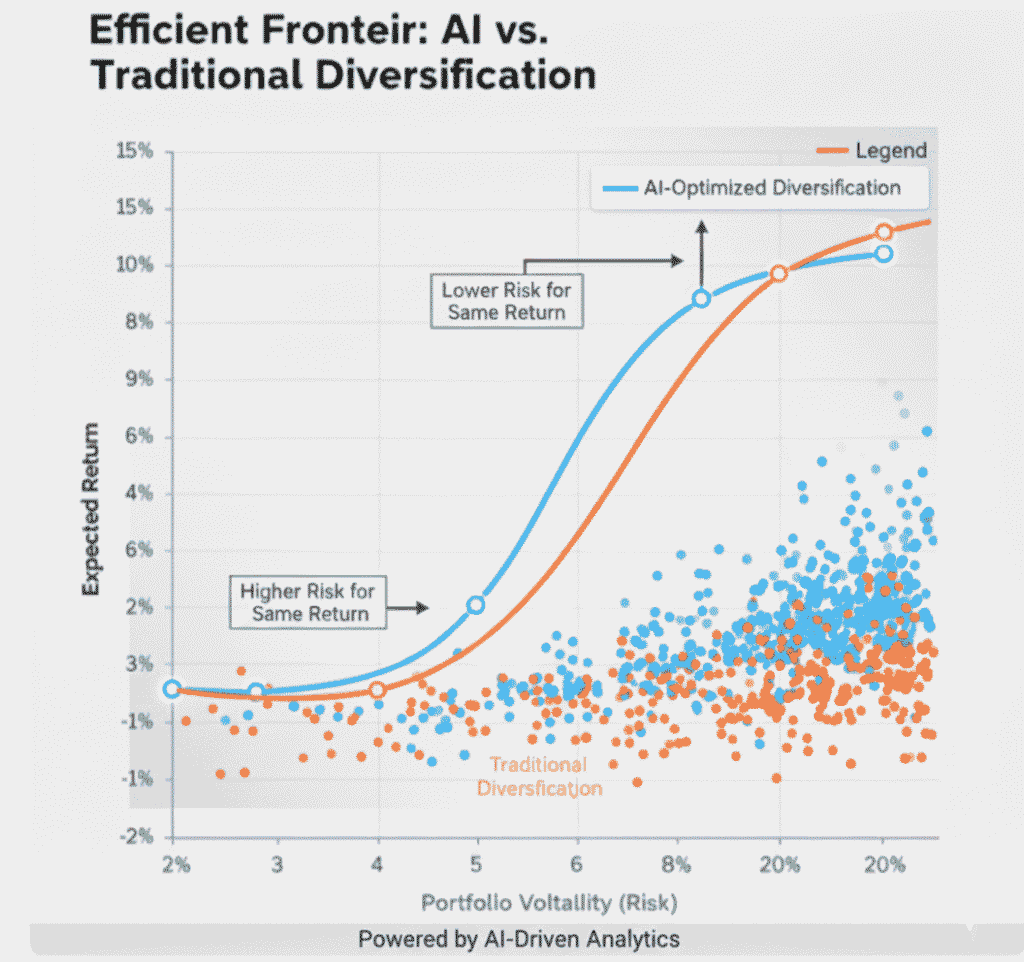
Efficient Frontier (Risk vs Return) — Quick Breakdown
- AI consistently outperforms: For every risk level, the AI-optimized portfolio delivers higher annual returns than traditional diversification.
- Low risk (5% volatility): Traditional: 1.0% → AI: 2.5% (+1.5 pts)
- Medium risk (10% volatility): Traditional: 4.5% → AI: 7.0% (+2.5 pts)
- High risk (15% volatility): Traditional: 9.0% → AI: 11.5% (+2.5 pts)
At the same 10% risk, AI gives you an extra 2.5% return—every year—just by reallocating smarter.
Dynamic Risk Scoring
Risk isn’t static. Your risk model shouldn’t be either. AI gives you real-time signals like:
- Early distress indicators
- Supply/demand imbalances are forming quietly in the background
- Financing risk as rate conditions shift
- Climate & environmental exposure long before insurers react
Multi-Factor Risk Radar Chart: Portfolio Risk Evolution
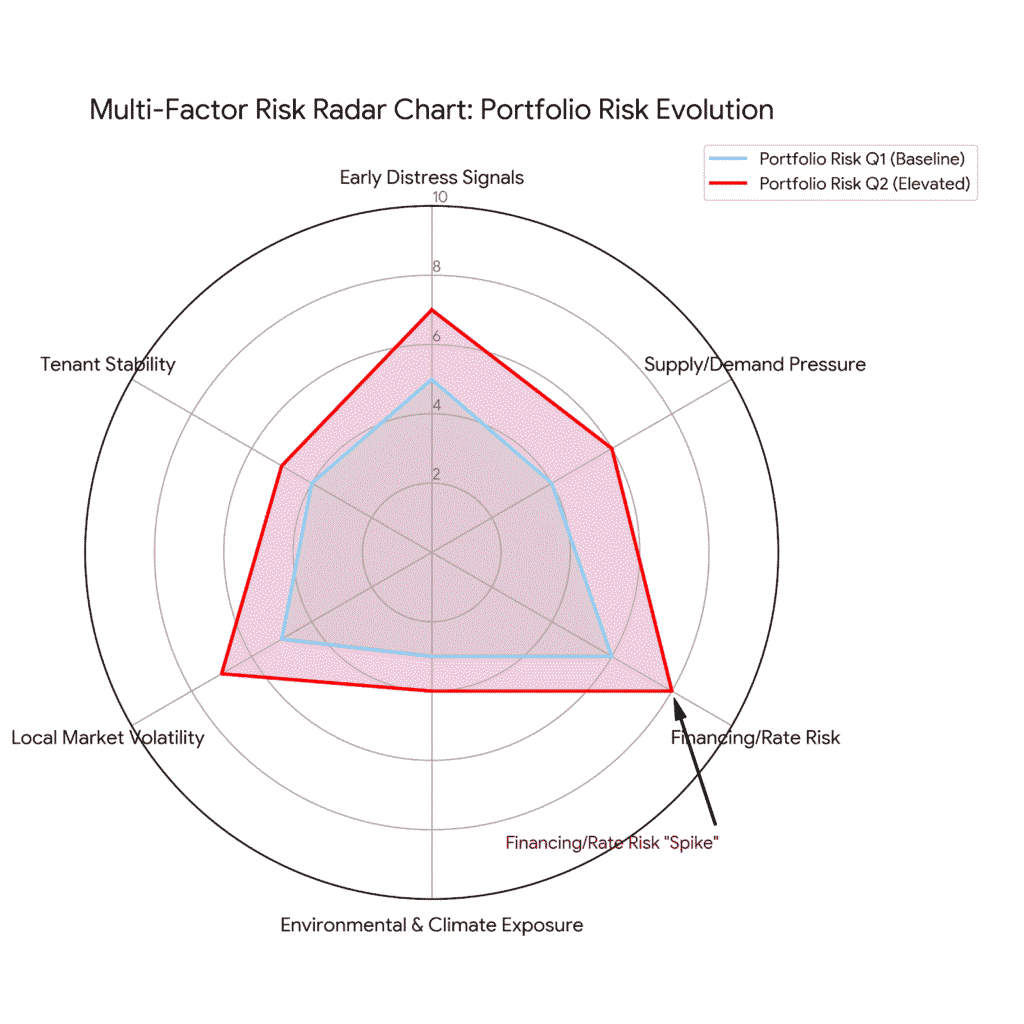
This chart shows two different risk profiles for a real estate portfolio:
- Light Blue Polygon (Q1 Baseline): Represents a relatively balanced risk profile under normal conditions.
- Red Polygon (Q2 Elevated): Shows a magnified risk profile, indicating a shift where certain factors have spiked.
The visualization clearly highlights the elevated risk in Financing/Rate Risk and Local Market Volatility (where the red polygon extends furthest), demonstrating how the AI instantly identifies which specific threats are driving portfolio risk. This enables precise and timely downside protection measures.
It’s like upgrading from quarterly risk reviews to a live dashboard of threats.
Predictive Cash Flow Stability
Cash flow lies. AI catches it. It forecasts:
- Rental declines before your PM reports them
- Vacancy swings driven by micro-market changes
- Renewal probabilities based on tenant patterns
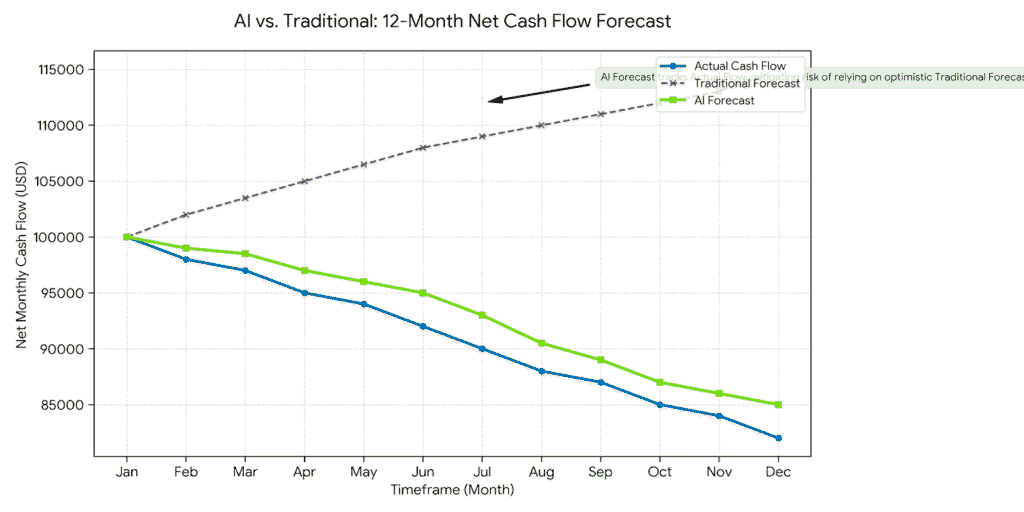
AI vs. Traditional: 12-Month Net Cash Flow Forecast
- Actual Cash Flow (Blue Line): Shows the real performance, which experienced a slight but steady decline over the year.
- Traditional Forecast (Red Dashed Line): Displays a typical forecast that assumes linear, continuous growth, severely overestimating cash flow, especially in the later months.
- AI Forecast (Green Line): Demonstrates the AI model’s accuracy. By incorporating dynamic risk factors and non-linear patterns, the AI forecast closely mirrors the trend of the Actual Cash Flow, recognizing the underlying decline.
This accuracy is crucial for downside protection and effective capital planning, as it prevents reliance on inflated financial projections.
Your underwriting stops being optimistic.
It becomes accurate.
What Top Investors Are Doing Right Now
If you really want to understand where the market is going, watch what the smartest money is already doing.
Institutional funds?
They’re feeding AI 20+ years of portfolio data and letting it surface patterns humans never had the bandwidth to see.
HNWIs?
They’ve stopped waiting for the annual review—they’re rebalancing every quarter, because AI shows when risk starts leaking into the portfolio long before the spreadsheets do.
Portfolio managers?
They’re running “what-if simulations” before deploying a single dollar.
“What happens to my yield if absorption rates in Dallas drop 7%?”
AI answers that in seconds.
Every month you operate without AI is a month your competitors expand their information advantage.
This is the technology you should use to your advantage — it can scan thousands of parameters in minutes, catching patterns and risks that humans often miss.
This isn’t optional anymore. It’s compounding, silently, relentlessly.
Implementation Framework
Here’s the 4-step playbook anyone can follow — even if you’re not a “data person.”
Step 1: Audit Your Current Portfolio
Get a clear picture of what you already own:
- Which markets are you invested in?
- Where are assets too similar (high correlation)?
- Which properties create the most volatility?
If the foundation is unclear, AI can’t improve it. Start by understanding your baseline.
Step 2: Plug In Predictive Tools (Start Free)
You don’t need an expensive $50k analytics platform. Start simple with:
- Free real-estate risk dashboards
- Market prediction APIs
- Basic correlation tools
The goal: get signal, not perfection.
Optional: If You Want More Accuracy — Add a Custom AI Layer
For portfolios with high complexity or multi-market exposure, a custom model can outperform off-the-shelf tools. Custom AI can:
- Combine your proprietary data (rent rolls, tenant histories, NOI, micro-market trends)
- Predict unique risks specific to your portfolio
- Build scenario simulations tailored to your strategy
It’s the difference between generic insights and intelligence built for your assets.
Step 3: Run Diversification & Risk Simulations
This is where the magic happens. Ask your tools:
- “What happens to my portfolio if rents drop 5%?”
- “Which asset drags performance during a downturn?”
- “Where can I add exposure with lower correlation?”
Let the models stress-test your assumptions.
Step 4: Rebalance Based on Predictive Insights — Not Old Spreadsheets
This is the shift. Stop managing risk with last year’s numbers.
Rebalance using what the next 6–12 months actually look like.
Small moves → Predictive moves → Compounding advantage.
The Strategic Edge: Why This Matters in 2025–2030
Let’s zoom out for a second — because this isn’t just about “better analytics.” This is about how real estate leaders win (or get steamrolled) over the next decade. Here’s the uncomfortable truth:
Capital isn’t chasing the biggest portfolios anymore — it’s chasing the smartest ones. And AI is the line between the two.
Better Downside Protection: Your competitors aren’t waiting for downturns to hit anymore. They’re spotting early distress signals months in advance — and quietly reallocating before the storm shows up in your quarterly report.
Faster Allocation Decisions: Decision cycles that used to take 6 weeks now take 6 minutes. If you’re still “reviewing the data,” someone else already deployed capital, locked the terms, and took the upside.
Stronger Institutional Reporting: LPs want clarity, not storytelling. AI gives you defensible, data-backed reasoning:
- Why you moved the capital
- Where risk is rising
- How performance holds under 50 different scenarios
It turns your reports from “nice charts” into “investment conviction.”
Higher Long-Term Performance: When you combine predictive insight + faster pivots + tighter risk control, performance stops being cyclical luck. It becomes engineered.
This is the moment. 2025–2030 will be the decade where the smartest portfolios pull away from everyone else.
Not because they bought more assets —but because they made better decisions, faster, with clearer foresight. Boardrooms love that. Investors love that. Your future self will love that.
Essential AI Tools for Portfolio Management
The real estate investment landscape is rapidly transforming through AI investment tools and insights, helping investors make data-driven portfolio decisions and automate complex risk assessments.
However, for superior results, you will ultimately need a custom-developed AI solution. Ready-made, off-the-shelf AI tools have inherent limitations that prevent them from delivering an optimal, high-performance strategy for your specific business. Here are some tools:
Real Capital Analytics (RCA) Portfolio IQ
- Core Capabilities: Comprehensive portfolio analytics, risk assessment, market intelligence, predictive modeling
- Key Features: Correlation analysis across 200+ variables, scenario modeling, rebalancing recommendations, acquisition screening
- Target Users: Institutional investors, portfolio managers with $50M+ assets under management
CoStar Portfolio Strategy
- Core Capabilities: Market analysis, property valuation, portfolio optimization, investment strategy development
- Key Features: Automated property screening, comp analysis, market forecasting, portfolio diversification analysis
- Target Users: Commercial real estate investors and portfolio managers
- Strengths: Particularly strong for commercial property portfolio management
PropertyMetrics Portfolio Analyzer
- Core Capabilities: Portfolio performance tracking, cash flow modeling, risk analysis, optimization recommendations
- Key Features: Automated data aggregation, performance benchmarking, diversification scoring, rebalancing alerts
- Target Users: Individual investors with 5-20 properties, small portfolio managers
Entera Portfolio Intelligence
- Core Capabilities: Single-family rental portfolio analytics, market trend analysis, acquisition recommendations
- Key Features: Market scoring, property-level predictions, portfolio composition analysis
- Target Users: Single-family rental investors and small portfolio operators
Reonomy Portfolio Risk Assessment
- Core Capabilities: Ownership intelligence, property analysis, risk scoring, portfolio composition analysis
- Key Features: Tenant industry analysis, ownership pattern recognition, concentration risk identification
- Target Users: Investors focused on commercial properties and tenant risk
DealCheck Portfolio Dashboard
- Core Capabilities: Basic portfolio tracking, performance analysis, simple diversification metrics
- Key Features: Property-level analysis, cash flow tracking, basic reporting
- Target Users: Newer investors with 1-10 properties
Why You Need a Custom Solution
Ready-made, off-the-shelf AI tools have inherent limitations that prevent them from delivering an optimal, high-performance strategy for your specific business:
- Generic Models vs. Proprietary Data: Ready-made tools are trained on publicly available or broad-based datasets. They cannot effectively incorporate your proprietary, unique, or high-value internal data (e.g., specific alternative data sources, granular real estate performance metrics, or unique customer segmentation profiles) that could provide a true competitive edge.
- Inflexible Investment Logic: Off-the-shelf algorithms operate on standardized investment philosophies and risk models. They are not built to align with your firm’s specific, nuanced, and proven investment mandates, regulatory constraints, or sophisticated asset allocation rules. Your unique alpha-generating strategies require models coded to your exact logic.
- Integration and Workflow Silos: Generic tools often function as silos, requiring cumbersome manual data transfers or basic API connections that don’t fully integrate with your existing legacy systems, CRMs, or core enterprise software. A custom solution is built to be a seamless, end-to-end component of your existing operational workflow.
- Limited Competitive Advantage: While a standardized tool can provide a baseline efficiency boost, it’s available to your competitors as well. A custom-built AI system, developed to leverage your unique data and processes, creates a sustainable, defensible competitive advantage that is impossible to replicate with a subscription service.
- Scalability and Evolution: Your business and market strategy will evolve. A custom solution can be scaled, updated, and retrained in-house to adapt immediately to new asset classes, changing market conditions, or shifts in your compliance framework—a flexibility a locked-down vendor product cannot offer.
Common Mistakes to Avoid
Understanding common errors prevents costly mistakes during AI adoption.
Mistake 1: Over-Trust AI Without Understanding Recommendations
The Error: Blindly following AI recommendations without understanding the underlying logic or validating assumptions.
Example: Imagine an investor whose AI system recommended selling a strong-performing property. The investor executed the sale without questioning why, only to discover later that AI had flagged a localized risk factor (planned highway closure) that was already publicly resolved. The recommendation was based on outdated information the investor could have easily verified.
The Solution:
- Always review the reasoning behind AI recommendations
- Verify key assumptions and data currency
- Question recommendations that contradict your market knowledge
- Treat AI as a sophisticated advisor, not an infallible oracle
- Maintain decision-making authority rather than automating choices
Implementation: For each major recommendation, ask: “What factors drove this recommendation?” “What would change this recommendation?” “Do I have information AI doesn’t?”
Mistake 2: Neglecting Portfolio-Level Thinking
The Error: Evaluating individual properties in isolation rather than considering portfolio-wide impact.
Common Scenario: Consider a scenario – An investor finds a property with excellent standalone returns and purchases it, despite AI warnings that it increases portfolio correlation. The property performs well individually but increases overall portfolio risk, creating vulnerability during market stress.
The Solution:
- Always evaluate acquisitions in a portfolio context
- Consider how each property affects overall diversification
- Prioritize portfolio-level metrics over individual property performance
- Understand that sometimes rejecting good properties improves portfolio outcomes
- Make decisions based on portfolio optimization, not property optimization
Mistake 3: Ignoring Correlation in Favor of Returns
The Error: Chasing the highest returns without considering correlation to existing holdings.
Typical Pattern: An investor owns properties in Austin, generating 16% returns. They find another Austin property offering 18% returns and acquire it, ignoring that it increases the dangerous geographic and economic concentration.
The Solution:
- Accept lower returns on individual properties if they improve portfolio characteristics
- Understand that 12% returns with low correlation often outperform 18% returns with high correlation on a risk-adjusted basis
- Diversification value has real monetary worth—calculate and consider it
- Sometimes the best investment is the one that makes your portfolio more stable, not more profitable
Mistake 4: Analysis Paralysis from Too Much Data
The Error: Becoming overwhelmed by AI-provided data and insights, leading to decision paralysis rather than better decisions.
Common Experience: An investor implements sophisticated AI portfolio management, receives hundreds of data points and recommendations, and becomes unable to determine which insights matter most or what actions to prioritize.
The Solution:
- Start with 3-5 key metrics that matter most to your strategy
- Configure AI systems to highlight priority issues rather than displaying everything
- Create simple decision frameworks for acting on AI insights
- Schedule regular but limited review sessions (2 hours monthly) rather than continuous monitoring
- Remember that analysis serves decisions—if you’re not making better decisions faster, simplify
Mistake 5: Short-Term Focus Undermining Long-Term Strategy
The Error: Reacting to every AI alert and short-term prediction rather than maintaining strategic focus.
Problematic Behavior: An investor receives AI alerts about short-term market fluctuations and constantly adjusts their portfolio, incurring transaction costs and taxes that overwhelm any benefit from tactical adjustments.
The Solution:
- Distinguish between strategic portfolio adjustments and tactical noise
- Set minimum thresholds for acting on recommendations (e.g., only rebalance when correlation drift exceeds 0.15)
- Maintain long-term strategic allocation despite short-term market movements
- Calculate transaction costs and taxes before acting on recommendations
- Remember that portfolio optimization is a marathon, not a sprint
Mistake 6: Failing to Validate AI Accuracy Over Time
The Error: Never tracking whether AI predictions prove accurate, leading to either blind trust or uninformed skepticism.
Better Approach:
- Systematically track all predictions and actual outcomes
- Calculate accuracy rates for different prediction types (risk assessment, market timing, property performance)
- Identify which AI recommendations prove reliable and which require skepticism
- Adjust your trust calibration based on actual performance
- Share accuracy feedback with AI vendors for system improvement
Implementation: Maintain a simple tracking spreadsheet:
- Date of prediction
- Prediction specifics
- Confidence level indicated
- Actual outcome
- Accuracy assessment
- Notes on factors affecting accuracy
Mistake 7: Underestimating Implementation Time and Learning Curve
The Error: Expecting immediate results and perfect implementation without adequate learning investment.
Reality Check: Quality AI portfolio management requires 2-3 months minimum to implement effectively:
- 2-4 weeks: Data gathering and system setup
- 4-6 weeks: Learning system capabilities and interpretation
- 4-8 weeks: Initial strategy development and first adjustments
- 3+ months: Validation of recommendations and trust calibration
The Solution:
- Set realistic expectations for the implementation timeline
- Allocate dedicated time for learning and setup
- Start with simple features before advancing to complex capabilities
- Expect initial decisions to be slow as you learn—speed comes with experience
- Measure success over quarters and years, not days and weeks
The Future of AI Portfolio Management
1. Real-Time Portfolio Optimization (2025–2026)
AI will soon update your portfolio continuously—not weekly or daily.
You’ll get instant alerts when:
- A perfect acquisition hits the market
- Correlations spike and risk increases
- A rebalancing window opens
This gives investors a major speed advantage. Full real-time systems will be common by 2026.
2. Climate & ESG Risk Integration (2025–2027)
AI will combine long-term climate models with property valuations. It will predict:
- Flood, wildfire, and extreme-weather risks
- Future insurance cost spikes
- Long-term value erosion
Investors using this will avoid climate-risk “time bombs” and shift toward resilient markets.
3. Autonomous Portfolio Management (2027–2029)
AI won’t just recommend—it will take action.
Future systems could:
- Auto-rebalance your portfolio
- Place bids on low-correlation assets
- Execute sell decisions during peak windows
You set the rules; AI handles the execution. Human oversight remains essential.
4. Quantum Computing Optimization (2028–2030)
Quantum AI will analyze thousands of variables at once—something impossible today.
It enables:
- Near-perfect diversification
- Massive scenario testing
- Ultra-accurate risk predictions
This could add 2–3% extra returns annually for large portfolios.
5. Personalized AI Portfolio Advisors (2026–2028)
AI will learn your style—your risk tolerance, preferred markets, timing, and goals.
It will deliver recommendations tailored specifically to you, not generic templates.
Result: Smarter decisions with less effort.
Takeaways
Prediction beats diversification guesswork.
Most portfolios aren’t “diversified” — they’re just spread out. AI replaces gut-feel allocation with data-backed foresight.
AI turns lagging indicators into leading ones.
By the time traditional models react, the market has already moved. AI sees those shifts early.
Your portfolio compounds intelligence every month the model learns.
Human intuition stagnates. Machine learning doesn’t — it gets smarter with every new data point.
Risk doesn’t disappear — it just stops blindsiding you.
You can’t eliminate volatility, but you can stop being surprised by it.
Investors who predict win. Investors who react get wiped out.
2025–2030 belongs to proactive investors, not those still waiting for quarterly reports to “tell them what happened.”
Frequently Asked Questions (FAQs)
Q: How large does my portfolio need to be before AI portfolio management is worthwhile?
A: AI portfolio management provides value starting at 3-5 properties, though the specific tools and investment level vary by portfolio size. With 3-5 properties, free or low-cost tools ($20-50 monthly) help identify basic diversification issues and correlation risks. With 5-15 properties, mid-tier solutions ($100-300 monthly) justify their cost through better optimization. With 15+ properties, sophisticated platforms ($300-2,000+ monthly) provide returns exceeding their costs through preventing mistakes and enhancing returns. Even single-property investors benefit from understanding portfolio principles for future growth planning.
Q: I’m not technical—can I still use AI portfolio management tools?
A: Modern AI portfolio management platforms are designed for real estate investors, not data scientists. If you can use Excel and online banking, you can use these tools. Most platforms provide user-friendly interfaces, comprehensive training materials, and customer support. The learning curve typically requires 2-4 weeks of regular use to become comfortable. Start with simpler tools like DealCheck or PropertyMetrics that prioritize ease of use, then advance to more sophisticated platforms as your skills and needs grow.
Q: How much time does AI portfolio management require weekly?
A: Initial setup requires 8-12 hours over 2-3 weeks for data gathering and system configuration. Ongoing management typically requires 1-2 hours monthly for portfolio reviews and strategic decisions. AI dramatically reduces time spent on analysis—tasks requiring 6-8 hours monthly with traditional methods often take 30-45 minutes with AI tools. However, you should invest saved time in higher-value activities like market research, relationship building, and strategic planning rather than simply reducing overall time investment.
Accuracy and Reliability Questions
Q: How accurate are AI portfolio risk predictions?
A: Accuracy varies by timeframe and prediction type. Short-term risk predictions (6-12 months) achieve 82-88% accuracy in identifying whether specific risks will materialize. Market cycle predictions reach 76-84% accuracy in forecasting market direction 6-12 months ahead. Long-term forecasts (24+ months) drop to 60-72% accuracy due to increasing variables and uncertainty. Prediction accuracy depends heavily on data quality, market stability, and whether unprecedented events occur. Quality systems always indicate confidence levels alongside predictions, helping you understand reliability. These accuracy rates significantly outperform traditional human analysis, which typically achieves 55-65% accuracy for similar predictions.
Q: What if AI recommendations contradict my market knowledge or intuition?
A: Disagreement between AI and your judgment warrants investigation, not automatic acceptance of either view. First, understand the reasoning behind AI’s recommendation—what data and patterns drove the analysis? Second, identify what information you have that AI might not—local market knowledge, upcoming developments, and regulatory changes. Third, consider whether your intuition might reflect cognitive biases rather than objective analysis. Sometimes AI is correct and reveals blind spots in human judgment. Other times, human knowledge captures local factors that data cannot represent. Best practice: treat significant disagreements as prompts for deeper analysis rather than immediately accepting or rejecting either view.
Q: How do I know if AI portfolio management is actually improving my returns?
A: Measure improvement across multiple dimensions over 12+ months. Track: 1) Risk-adjusted returns (Sharpe ratio) comparing return per unit of risk before and after AI implementation. 2) Portfolio correlation coefficients showing whether diversification actually improved. 3) Avoided mistakes—track properties or timing you avoided based on AI warnings that proved correct. 4) Time savings quantified by hours saved monthly. 5) Decision confidence—whether you make faster, more assured investment choices. Improvement appears in reduced stress and better sleep as much as in financial returns. Most investors see measurable improvement within 6-9 months, with continued enhancement over subsequent years as skills develop.
Implementation and Strategy Questions
Q: Should I rebalance my portfolio immediately based on AI recommendations?
A: No. Immediate radical rebalancing often creates more problems than it solves—triggering taxes, incurring transaction costs, and forcing sales at inopportune times. Instead, implement strategic rebalancing over 12-24 months: 1) Identify the 3-5 highest-priority portfolio improvements, 2) Develop implementation strategy considering taxes, market timing, and capital availability, 3) Execute changes methodically as opportunities arise rather than forcing immediate action, 4) Track outcomes to validate AI recommendations before making larger changes, and 5) Maintain long-term strategic focus despite short-term market fluctuations. Think of portfolio optimization as an ongoing process, not a one-time event.
Q: Can AI help me decide which markets to invest in next?
A: Yes, this is one of AI’s strongest applications. AI analyzes your current portfolio composition, identifies which market characteristics would improve diversification, and screens available markets against optimization criteria. For example, if your portfolio is concentrated in tech-driven markets, AI might recommend manufacturing-based or government-adjacent markets with low correlation to technology sector. The system can analyze hundreds of markets simultaneously—considering economic drivers, demographic trends, affordability metrics, growth patterns, risk factors—and rank them by how well they’d improve your specific portfolio characteristics. This capability dramatically outperforms traditional market selection methods relying on limited manual research.
Q: How does AI portfolio management handle unique or unusual properties?
A: AI performs best with conventional property types having abundant comparable data—standard multifamily, office, retail, industrial. Unique properties—specialized uses, unusual locations, atypical tenant structures—may receive less reliable analysis due to limited comparable data. For unique properties: 1) Use AI for macro factors (market trends, economic conditions) while relying more on human judgment for property-specific factors. 2) Manually adjust AI’s inputs to better represent unique characteristics. 3) Weight AI recommendations lower for unusual properties versus conventional holdings. 4) Focus on portfolio-level insights (correlation, diversification), which remain valuable even when individual property analysis is less certain.
Advanced Topics
Q: Should I use multiple AI portfolio management tools or stick with one?
A: Most investors should master one comprehensive platform before adding others, . Multiple tools often provide contradictory recommendations, creating confusion rather than clarity. However, for superior results, you will ultimately need a custom-developed AI solution.
Ready-made, off-the-shelf AI tools have inherent limitations that prevent them from delivering an optimal, high-performance strategy for your specific business:
Scalability and Evolution: Your business and market strategy will evolve. A custom solution can be scaled, updated, and retrained in-house to adapt immediately to new asset classes, changing market conditions, or shifts in your compliance framework—a flexibility a locked-down vendor product cannot offer.
Generic Models vs. Proprietary Data: Ready-made tools are trained on publicly available or broad-based datasets. They cannot effectively incorporate your proprietary, unique, or high-value internal data (e.g., specific alternative data sources, granular real estate performance metrics, or unique customer segmentation profiles) that could provide a true competitive edge.
Inflexible Investment Logic: Off-the-shelf algorithms operate on standardized investment philosophies and risk models. They are not built to align with your firm’s specific, nuanced, and proven investment mandates, regulatory constraints, or sophisticated asset allocation rules. Your unique alpha-generating strategies require models coded to your exact logic.
Integration and Workflow Silos: Generic tools often function as silos, requiring cumbersome manual data transfers or basic API connections that don’t fully integrate with your existing legacy systems, CRMs, or core enterprise software. A custom solution is built to be a seamless, end-to-end component of your existing operational workflow.
Limited Competitive Advantage: While a standardized tool can provide a baseline efficiency boost, it’s available to your competitors as well. A custom-built AI system, developed to leverage your unique data and processes, creates a sustainable, defensible competitive advantage that is impossible to replicate with a subscription service.
Q: How does AI account for my personal goals and risk tolerance?
A: Quality AI systems allow customization of goals and risk parameters. You define: 1) Target return requirements and acceptable risk levels. 2) Time horizon for investment holding periods. 3) Geographic preferences or restrictions. 4) Property type preferences based on expertise. 5) Capital availability and leverage constraints. 6) Tax situation affecting optimal timing. The AI then generates recommendations optimized for YOUR specific situation rather than generic best practices. Periodically review and update these parameters as circumstances change. Less sophisticated tools use one-size-fits-all recommendations—a limitation worth considering during tool selection.
Q: What’s the biggest mistake investors make with AI portfolio management?
A: Expecting AI to eliminate risk rather than optimize it. AI dramatically improves portfolio construction and risk management but cannot eliminate market risk, predict unprecedented events, or guarantee returns. Investors who implement AI, expecting perfect safety, become disappointed when portfolios still experience volatility during market stress. Better mindset: AI helps you understand and optimize risk-return tradeoffs, identify concentration dangers before they materialize, and make more informed decisions—but cannot eliminate the inherent uncertainty in real estate investing. Successful AI users view it as sophisticated decision support, not a crystal ball or a safety guarantee.

Kamlesh Mandloi is a data scientist and AI architect with over 10 years of experience helping businesses overcome industry bottlenecks through the application of technology.